Internet Intelligence assists you in troubleshooting latency measurements for individual IP hosts. Enter a host IP address to measure the latency from each vantage point.
Troubleshooting an IP Host
| Once the Connectivity Test is complete, the Connectivity Results map is linked to the Individual Traceroute chart and the Starburst diagram. Select a traceroute on the map, chart, or diagram and the others align their display with the selection. | |
| 1. Select Troubleshooting from the navigation area. | |
| 2. Enter the IP host address that you want to troubleshoot. | 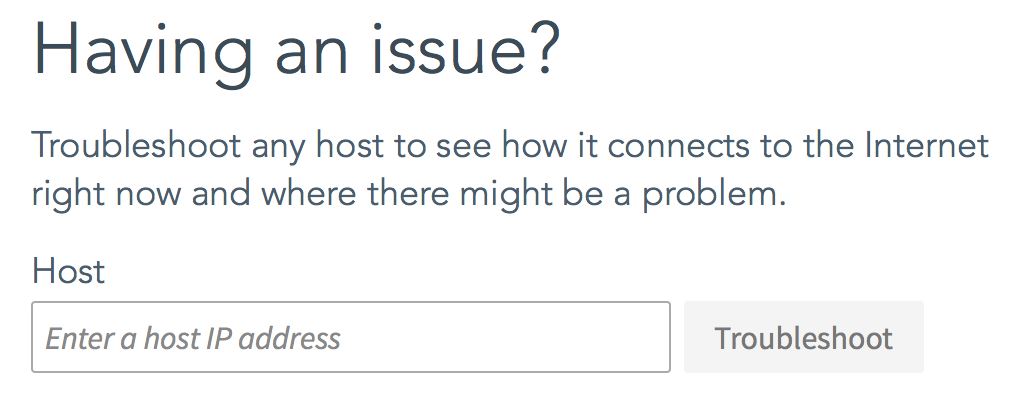 |
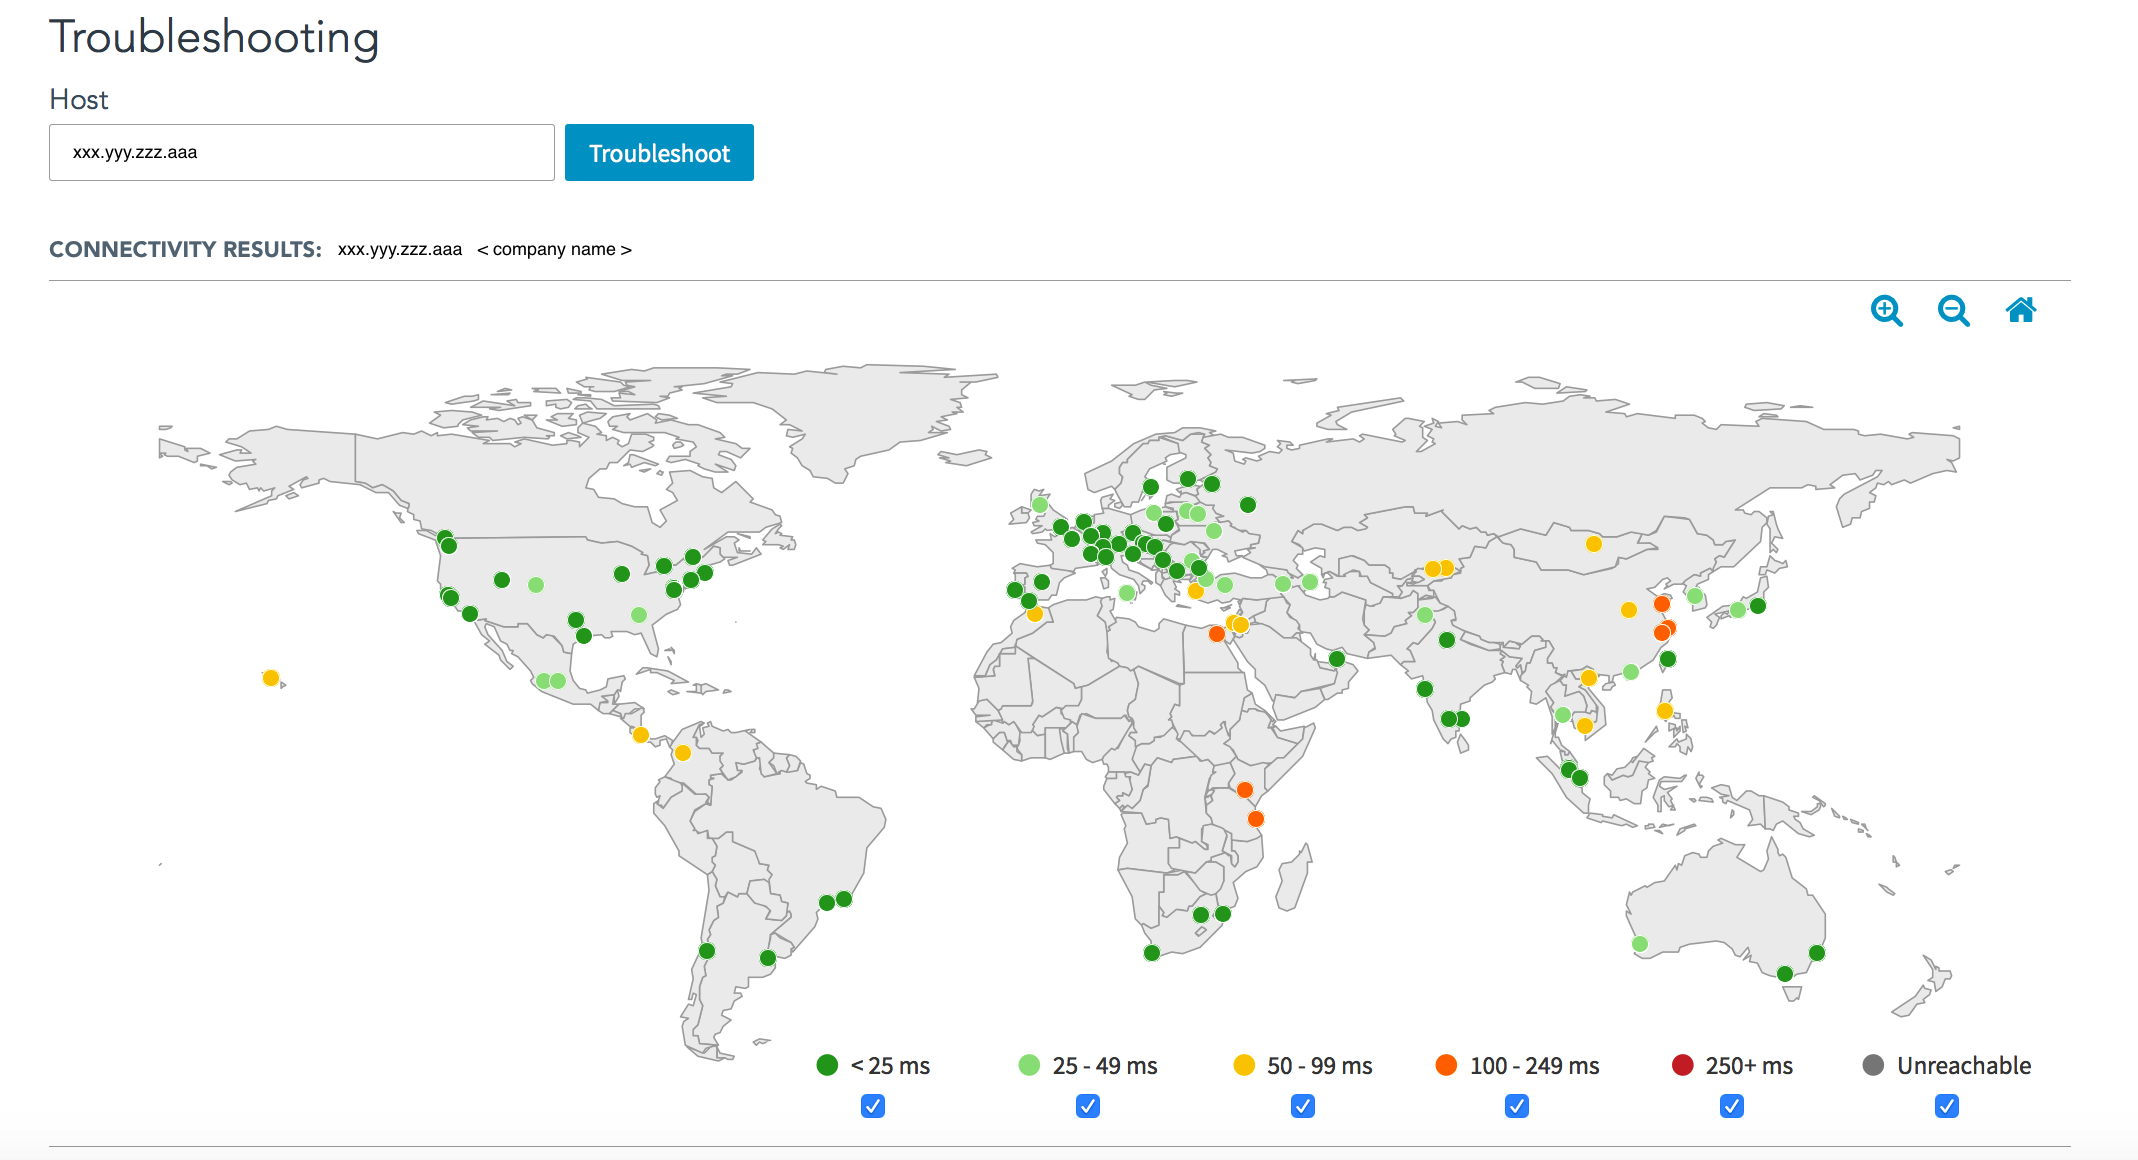
| 3. The map view will begin the connectivity tests and colored dots will appear for each vantage point as the test results arrive. Each colored dot represents the latency measurement, or indicates no response, from the vantage point.
Use the legend at the bottom of the map to understand the difference among the colored dots. Uncheck an item in the legend to remove that category from the map. Check an unchecked item to return that information to the map. All categories are shown by default. To run the connectivity test again, click the button labelled Troubleshoot at the top of the page. |
|
 |
|
Individual Traceroutes
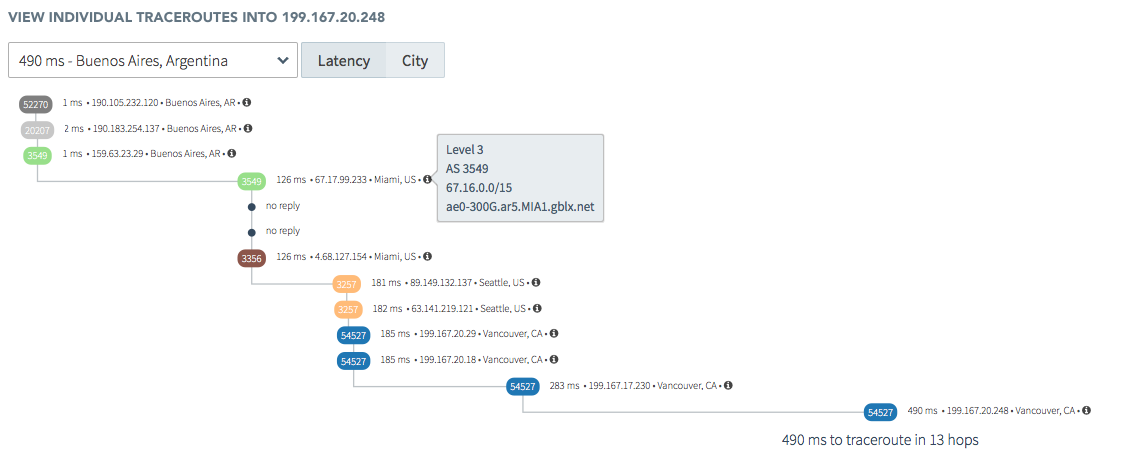
| Internet Intelligence can display individual Traceroute Paths from any vantage point to the IP address. The Individual Traceroute chart is linked to the Global map and the Starburst diagram.
Select a traceroute on the map, chart, or diagram and the others align their display with the selection. Use the drop-down list under the Connectivity Results map to view a specific traceroute from a chosen vantage point to the IP address. The drop-down list displays vantage points ordered from the highest Latency (worst performance) to the lowest (best performance) by default. Click City next to the drop-down list to view the vantage points ordered alphabetically by market city and country. Each hop in the traceroute shows the ASN, city and country location, IP address, and the latency time from the vantage point to that hop. Click the |
|
|
Traceroute Paths and Top Providers
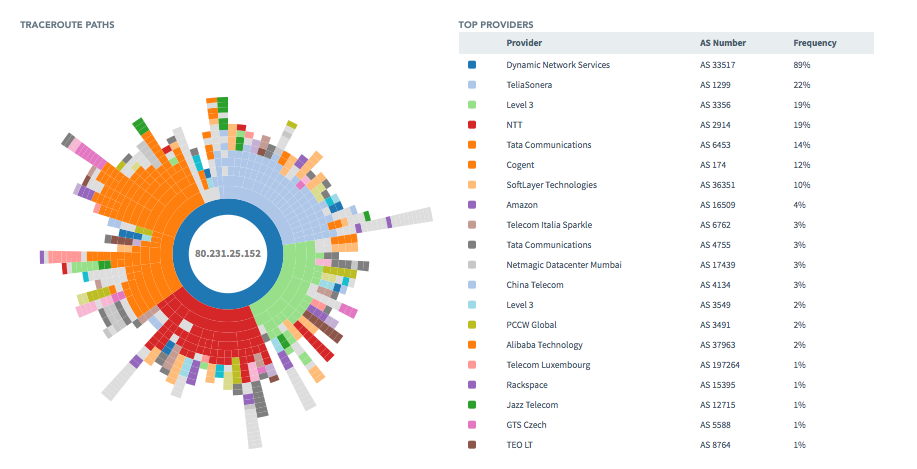
| Internet Intelligence also displays the Traceroute Paths Starburst and the Top Providers ranking table. Select a traceroute on the map, chart, or diagram and the others align their display with the selection. This makes it easier to troubleshoot/locate the problem with the appropriate AS number. Top providers display in ranking order with provider name and its frequency. Providers are color coded to match their usage in the starburst diagram. Mouse within the starburst to see various AS providers and their ranking status. | |
 |