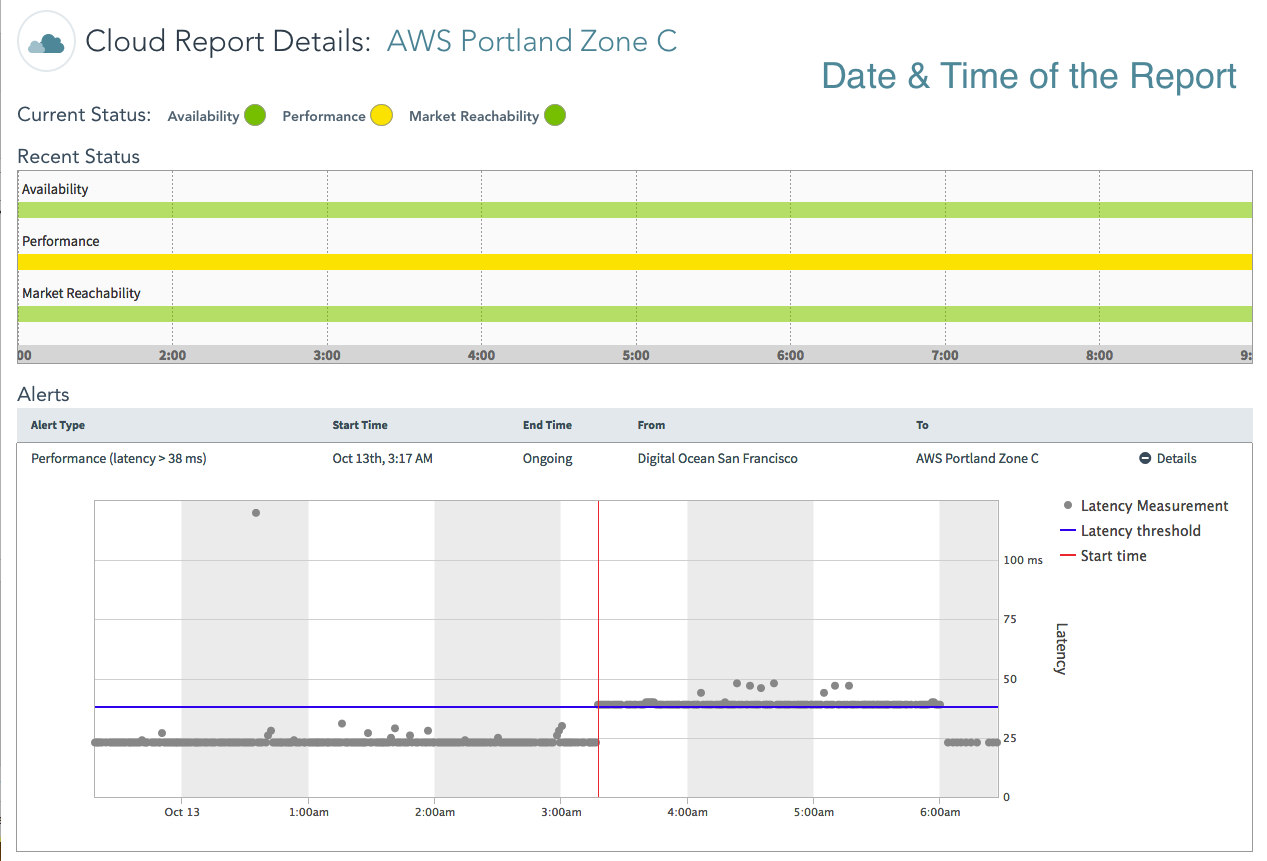
Internet Intelligence can monitor your Cloud, CDN, and host assets across the Internet. It raises an alert when a monitored asset crosses a predetermined threshold for one of the three metrics: performance, availability, or reachability.
| The Alerts report identifies the asset(s) where an alert registered and provides additional details on the alert. The two charts that are displayed will assist you in identifying the origin of the alerts identified. |
 |
| 8-Hour Alert History
A chart displaying the most recent eight hours of monitoring for the three metrics: performance, availability, and reachability. Any alerts identified for the asset are shown in the Alert table. |
| Alerts
A listing of alerts identified for the asset, including date and time the alert started, the date and time the alert ended (if ended), and the Cloud, CDN, or host location where the alert was identified. |
| Alert Details
Click to open a visual representation of the start time of the alert, the applicable latency measurements, and latency threshold. |
<< Internet Intelligence