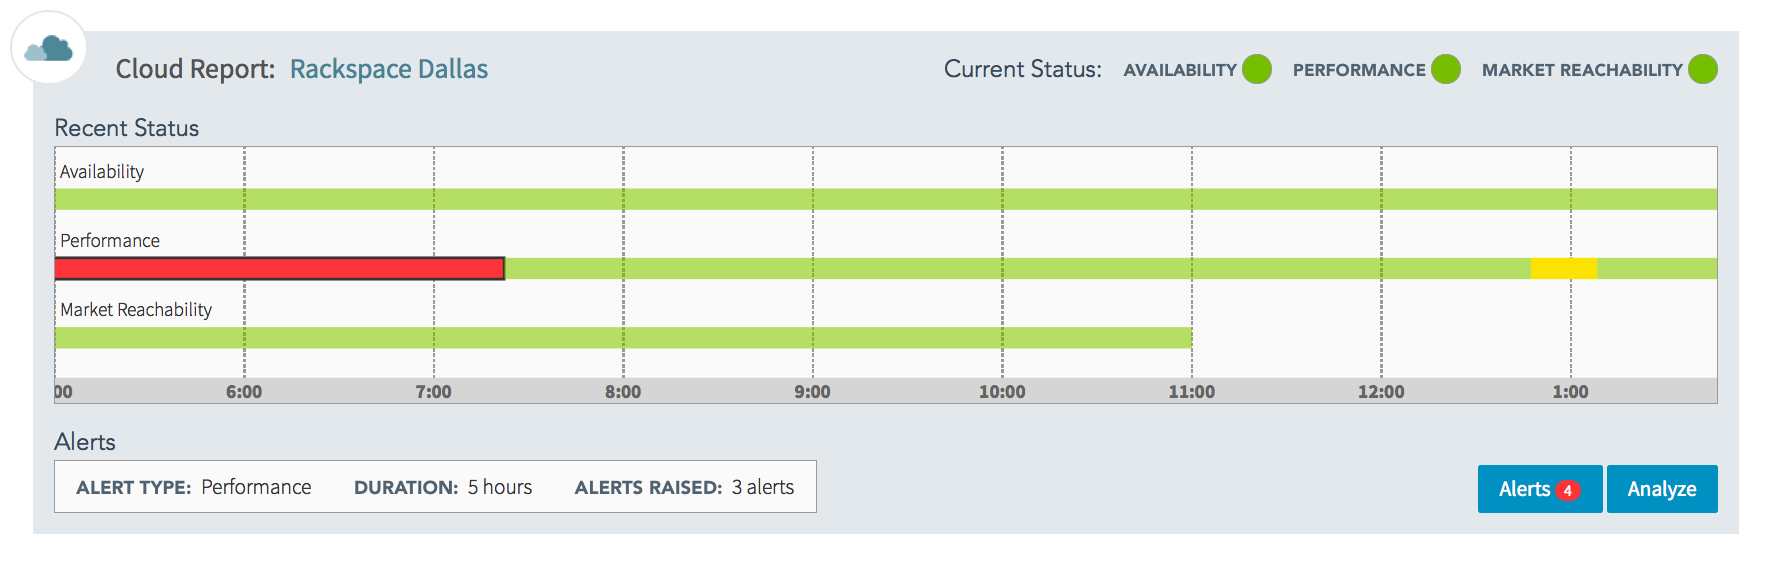
The Cloud Report displays the details that comprise the red/yellow/green rating at the top of the Dashboard view.
| Each Cloud Report is for a specific Cloud network location (for example, Rackspace Dallas). The Recent Status graph shows the status of each metric over the past 8 hours as online (green), degraded (yellow), or major degradation (red).
The graph is interactive. Click the section of the graph that shows either a degraded (yellow) or major degradation (red) status to see the alerts that make up this status. Additional Alerts information is located on the Alerts table. |
|
 |
|
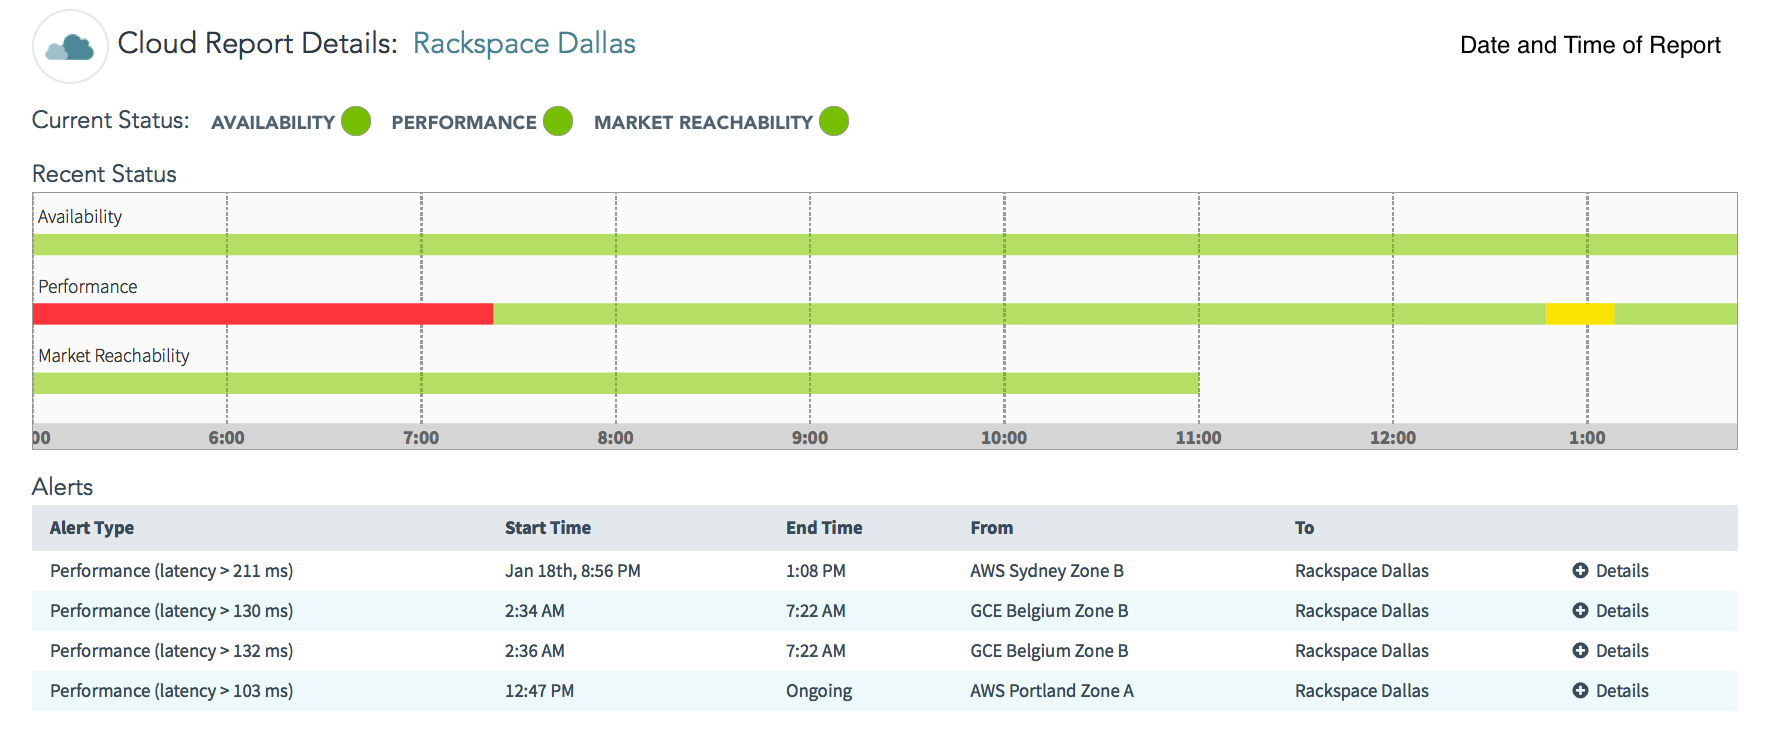
| Below the interactive bar graph for the Cloud Report are the Alerts and Analyze buttons. Click the Alerts button to view the Alerts table (see example below) The table displays all alerts for this instance along with the details of each alert. Click the plus sign (+) to see the detail measurement graph for that specific alert.
The Analyze button links to the Cloud Analytics view. Click the Analyze button to view the Cloud Performance Map. The Performance Map will autopopulate for the Cloud location associated with the alerts. |
|
|