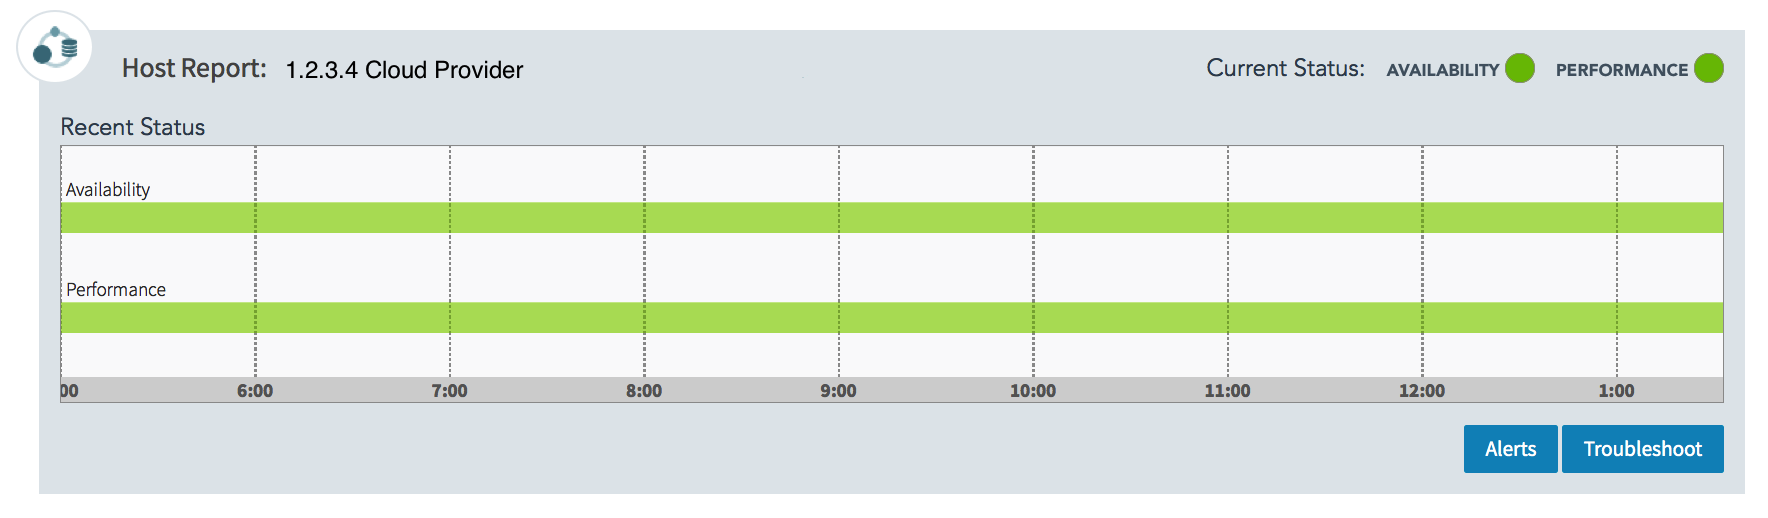
Your Host Report displays the availability and performance of specifically monitored IP addresses over the last 8 hours. Each Host Report is specific to one monitored IP address. Click the Alerts button for details about specific alerts.
| The Recent Status graph shows the status of each metric over the past 8 hours as online (green), degraded (yellow), or major degradation (red). | |
 |
|
| The graph is interactive. Click the section of the graph that shows either a degraded (yellow) or major degradation (red) status to see the alerts that make up this status. Additional alerts information is located on the Alerts table.
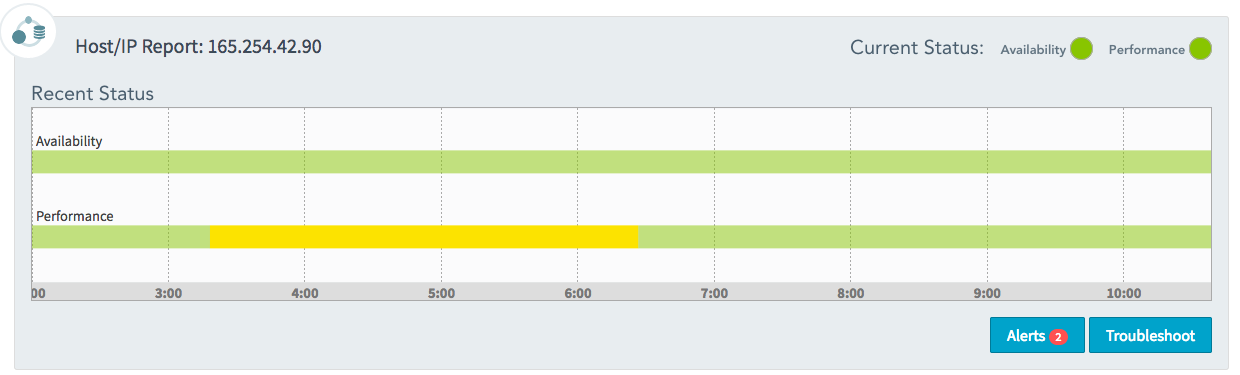
Underneath the interactive bar graph for the Host Report are the Alerts and Troubleshoot buttons. The Alerts button links to the Alerts table for the Host. The table displays all alerts for this host along with the details of each alert. The Troubleshoot button opens the troubleshooting page. The Troubleshooting Report will automatically run for the IP address associated with the Host Report. See Troubleshooting IP Host for more information.
|
|
| This example of the Host/IP Report shows that there are 2 alerts for the identified host. The bar graph shows a yellow section in the Performance line of the graph. The number of alerts (two in this example), appears in the Alerts button. | |
 |
|
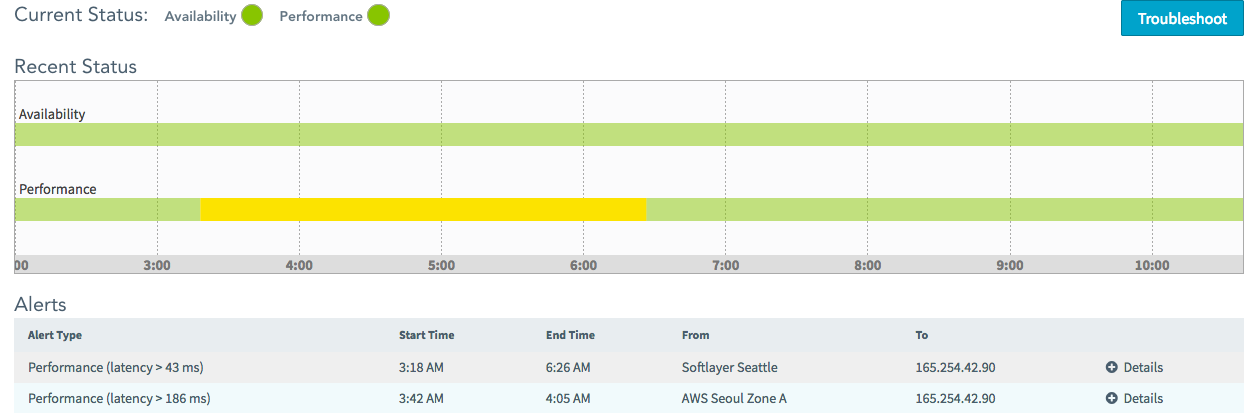
| After clicking the Alerts button, the Alerts list appears below the table. | |
 |
|
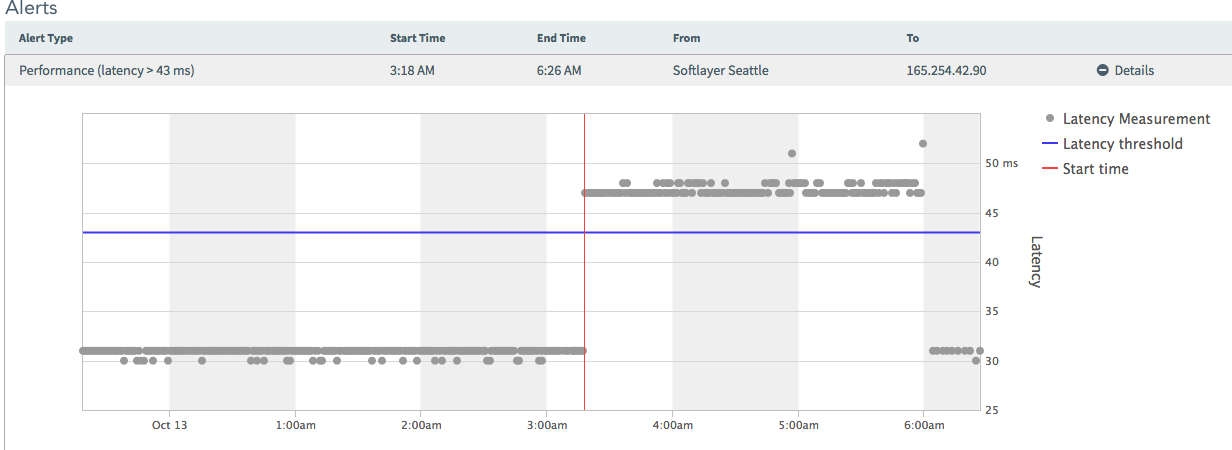
| Click the plus sign (+) next to Details on the right side of the alert to show the alert details. In this example, the Latency Measurements crossed the threshold (in blue) at 3:18pm (start time in red). | |
 |