Internet Intelligence allows you to monitor the world’s largest cloud and CDN providers to provide you with actionable insight about the availability, reachability, and performance of your Internet infrastructure. Monitor the performance of ASNs, Prefixes, Domains, Cloud services, CDNs, and Hosts from hundreds of vantage points around the globe. This starting guide will walk you through how to add the first assets to your Portfolio and begin to monitor them.
Logging In
To login to Internet Intelligence, you will need to create a DynID, if you don’t already have one.
Add Internet Intelligence to an existing DynID
Setting Up Your Portfolio
Follow the step below to setup add your first asset to your Portfolio and begin to monitor them.
| 1. The first time you log into Internet Intelligence, you will arrive at the Discover Assets screen. Type in an organization name, domain, ASN, IP prefix, cloud, CDN, or host into the search bar and click Discover Assets. | 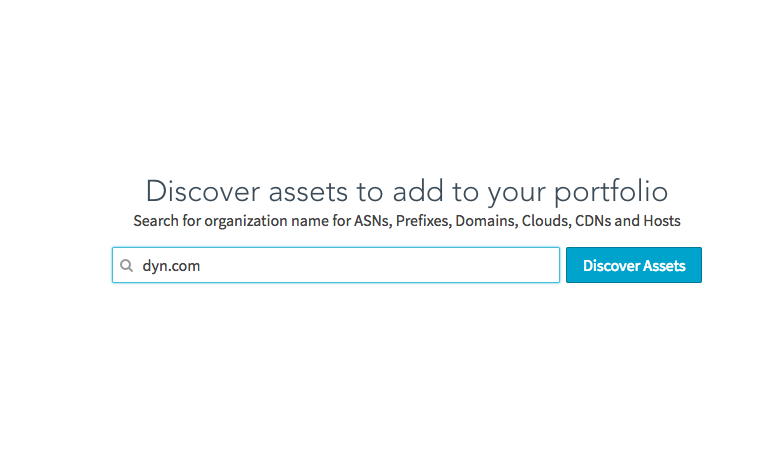 |
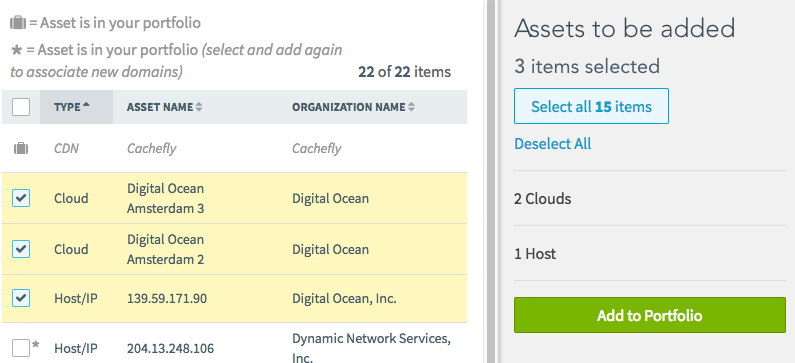
| 2. Internet Intelligence will detect all of the relevant assets associated with the network asset you typed into the search field.
Select which assets you would like to add to your Portfolio by clicking the individual checkboxes beside each asset and clicking Add to Portfolio. NOTE: You can select specific types of assets, or all the assets associated with a specific organization, by using the Asset Types and Organization Names filters. |
 |
| 3. Your selected assets will be added to your Portfolio. | |
Monitoring Your Assets
When assets are added to your Portfolio, monitoring is not enabled by default. Monitoring must be enabled on an asset before any analytics or alerts can be collected.
| 1. In the Portfolio section, check the box beside an individual asset and click Configure Monitoring. You can also click the small, white circle in the Monitored column to open the Monitor Configuration menu for that asset.
NOTE: You cannot select multiple assets and enable monitoring on all of them at once. |
 |
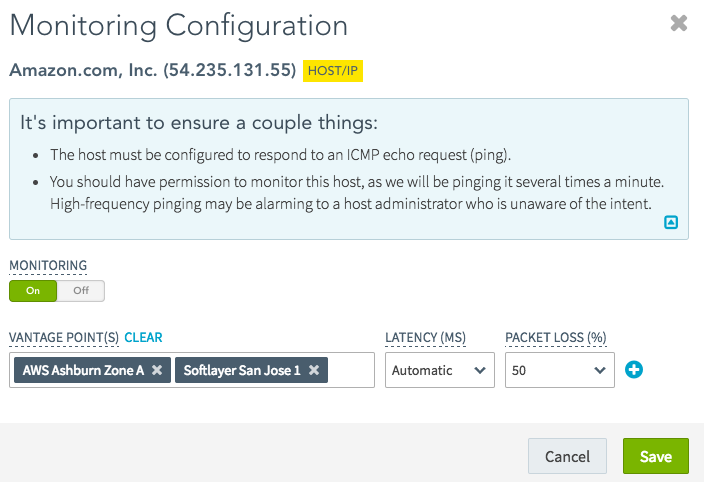
| 2. Click On under the Monitoring toggle switch.
Hosts and IPs will allow you to select Vantage Points. These are the services from where your IP address or host can be monitored. The Monitoring Configuration also allows you to set custom latency and packet loss thresholds that determine the level of degradation an asset must suffer before raising an alert. NOTE: To monitor a host, it must be configured to respond to an ICMP echo request (ping). |
 |
| 3.Click Save to begin monitoring the asset. |  |
Configure Email Alerts
Internet Intelligence allows you to be alerted via email when one of your assets begins experiencing performance issues, such as outages and instability.
| 1. Click Configure Alert Emails to open the Alert Email settings. | |
| 2. You can choose to receive emails about Routing Alerts and/or Performance Alerts.
Routing Alerts pertain only to the prefixes, ASNs, Cloud Zones, and CDNs that you are monitoring in your Portfolio. Performance Alerts only pertains to the hosts and IP addresses that you are monitoring in your Portfolio. |
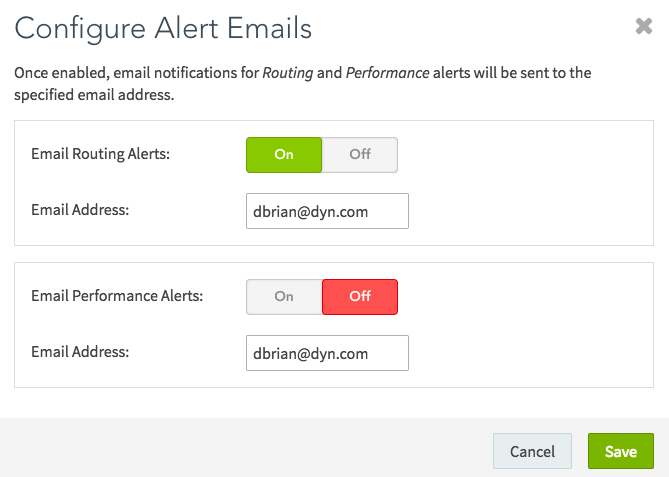 |
| 3. Click the On button and enter the email address of where you would like to receive alerts. Then click Save. | |
Analyze and Acknowledge Alerts
When you receive an alert, you can log into Internet Intelligence and view details and analytics about the alert, such as latency and packet loss over time. To remove old alerts from your Portfolio you will need to acknowledge them.
| 1. From the Internet Intelligence portal, click the Alerts tab.
From the Alerts tab, you can get an overview of all your alerts, including Start Time, End Time, and Severity. |
|
| 2. Click the checkbox beside an alert, then click Analyze Alert Details to view a Performance Timeline and other details about the alert. Visit our reports section (INTERNAL NOTE: LINK TO REPORT SECTION) for more information about each type of report. | 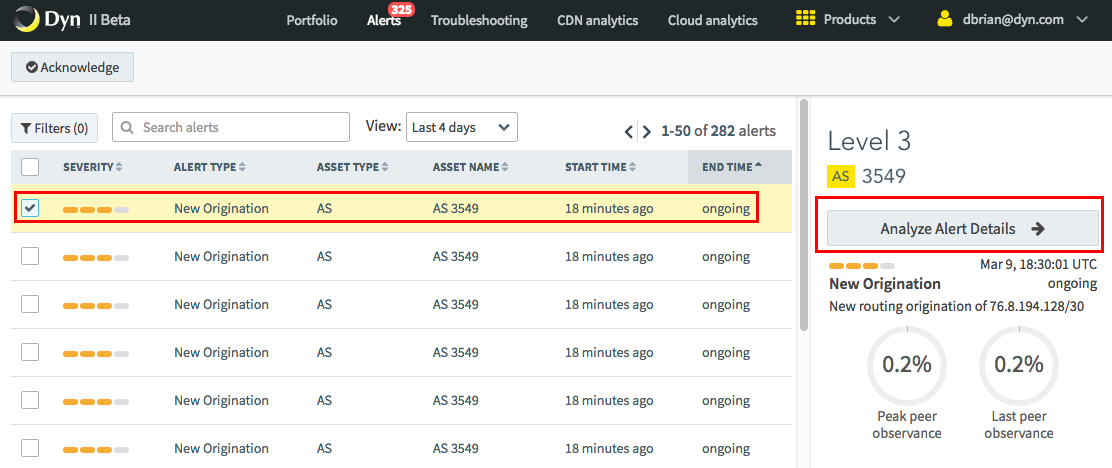 |
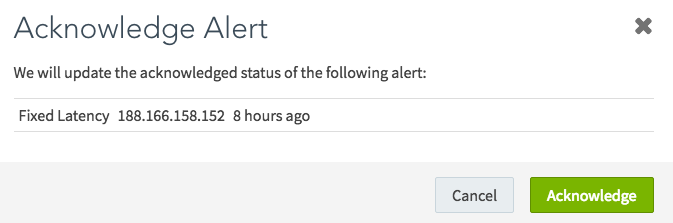
| 3. To acknowledge the alert, click Back to Alerts. | |
| 4. With the alert still highlighted, click Acknowledge then click Acknowledge in the confirmation window.
NOTE: You can acknowledge multiple alerts by clicking multiple checkboxes beside the alerts you want to acknowledge and clicking Acknowledge. Additionally, you can use the filter button to select alerts by type, status, and severity. |
 |