NOTE: If you do not have a DynID, or login to Internet Intelligence with Renesys credentials, you will have to access the API via a different URL.
Build and Manage Your Portfolio
| VERB | RESOURCE | REQUEST FIELDS | DESCRIPTION |
| GET | /portfolio | None | Retrieve a list of all inventories and assets. |
| DELETE | /portfolio | None | Delete all inventories and assets in a portfolio. |
| GET | /portfolio/inventories | None | Retrieve all inventories in a portfolio. |
| POST | /portfolio/inventories |
|
Creates an inventory. |
| DELETE | /portfolio/inventories/{inventory} | None | Delete a specified inventory. |
| PUT | /portfolio/inventories/{inventory} |
|
Enable or disable monitoring for an inventory. |
| GET | /portfolio/inventories/id/assets | None | Retrieve details about one asset. |
| GET | /portfolio/assets | None | Retrieves a list of assets. |
| POST | /portfolio/assets (one prefix) | (see below) | Add one or multiple assets to one or more inventories. |
| DELETE | /portfolio/assets | None | Delete an asset from an inventory. |
Configure Performance Monitoring
| VERB | RESOURCE | PARAMETERS (TYPE) | DESCRIPTION |
| POST | /portfolio/performance/inventories/{Inventory} |
|
Enable or disable monitoring for an Inventory. |
| PUT | /portfolio/performance/assets/{IP} (add collectors) |
|
Assigns alert thresholds for one or more collectors to the specified IP address. |
| DELETE | /portfolio/performance/assets/{IP} (remove collectors) | None | Removes all monitoring for the specified IP address. |
| GET | /portfolio/performance/collectors (available collectors) | None | Retrieves a list of available collectors. |
| GET | /portfolio/performance/assets/(IP} | None | Retrieve current collector configuration for this IP address. |
| PUT | /portfolio/performance/settings |
|
Changes the Performance Alerts email settings. |
| GET | /portfolio/performance/settings | None | Retrieves current email settings for your Internet Intelligence account. |
| GET | /portfolio/performance/ plot/{IP}/{collector_set} | Retrieves the past 4 hours of latency and packet loss history. | |
| GET | /portfolio/performance/alert/plot/{alert_id} | None | Retrieves graphing plot for the specified performance alert. |
| GET | /portfolio/performance/alert/data/{alert_id} | None | Retrieves JSON data for the alert identified. |
| GET | /portfolio/performance/alert/ traceroutes/{alert_id} | None | Retrieves up to two traceroute paths around (before and after) the alert. |
| GET | /portfolio/performance/alert/ traceroutes/latest/{ip}/{collectorset} | None | Retrieves the most recent traceroute path for the specified IP address and collector set. |
| GET | /portfolio/performance/alert/ traceroutes/historical/{IP}/{collectorset} |
|
Retrieves the most recent traceroute path for the specified IP address and collector set. |
| GET | /performance/data/{ip}/{collectorset} |
|
Retrieves the last four hours of latency data. |
Manage Your Alerts
| VERB | RESOURCE | PARAMETERS (TYPE) | DESCRIPTION |
| GET | /portfolio/monitoring/alerts (all alerts) | None | Retrieve a list of all alerts. |
| GET | /portfolio/monitoring/alerts (since given time) | None | Retrieve a list of all alerts since a given time. |
| GET | /portfolio/monitoring/alerts (unacknowledged alerts) | None | Retrieve a list of all unacknowledged alerts. |
| GET | /portfolio/monitoring/alerts (all alerts, one asset) | None | Retrieve all alerts for one asset. |
| GET | /portfolio/monitoring/types | None | Retrieves a list of alert types. |
| GET | /portfolio/monitoring/alerts/{alert id} | None | Retrieves the details for the alert identified. |
| POST | /portfolio/monitoring/bulkAcknowledge (all) | None | Acknowledge all alerts. |
| POST | /portfolio/monitoring/bulkAcknowledge (one asset) | None | Acknowledge alerts for one asset. |
| POST | /portfolio/monitoring/bulkAcknowledge (one type) | None | Acknowledge all alerts of one type. |
| POST | /portfolio/monitoring/bulkAcknowledge (one type, one asset) | None | Acknowledge one type of alert for one asset. |
| PUT | /portfolio/inventories/{id} (suppress alert) |
|
Enable or disable alerts for an inventory. |
Build and Manage Your Portfolio
GET /portfolio/
You can get a list of all assets and inventories included in your entire portfolio. These assets may be the IP prefixesand ASNs for Internet Routing Alerts and/or the IP Addresses for Internet Performance Alerts. The command to retrieve all the assets of the Portfolio is the same for both Internet Routing Alerts and Internet Performance Alerts APIs.
URI: https://dii.dynapis.com/portfolio
Legacy URI: https://api.renesys.com/portfolio
Request Body Fields (JSON):
- None
Example Response (JSON):
[
  {
    "comment": null,
    "suppressed": {
      "all": false,
      "categories": []
    },
    "monitoring": false,
    "assets": [
      {
        "comment": "Amsterdam Beacon",
        "assetType": "prefix",
        "info": {
          "geolocation": {
            "city": "Amsterdam",
            "country_code": "NL",
            "admindiv": "Provincie Noord-Holland",
            "adminsubdiv": null
          },
          "label": "Reseaux IP Europeens Network Coordination Centre (RIPE NCC)"
        },
        "name": "Beacon Prefix",
        "inventories": [
          "dan3"
        ],
        "payload": null,
        "id": "84.205.64.0/24"
      }
    ],
    "id": "dan3"
  }
]
DELETE /portfolio/
You can delete all inventories, monitoring configurations, and the portfolio itself. The command is the same for Internet Routing Alerts and Internet Performance Alerts APIs.
NOTE: If you have both Internet Routing Alerts and Internet Performance Alerts, there is only one portfolio for your account. All items for both products will be removed with this command.
URI: https://dii.dynapis.com/portfolio
Legacy URI: https://api.renesys.com/portfolio
Request Body Fields (JSON):
- None
Example Response:
HTTP/1.1 204 No Content
GET /portfolio/inventories
You can get a list of all inventories in your entire portfolio. These inventories may be used by Internet Routing Alerts, Internet Performance Alerts, or both. The command to retrieve all the inventories of the Portfolio is the same for both Internet Routing Alerts and Internet Performance Alerts APIs.
URI: https://dii.dynapis.com/portfolio/inventories
Legacy URI: https://api.renesys.com/portfolio/inventories
Request Body Fields (JSON):
- None
Example Response (JSON):
[
  {
    "comment": null,
    "monitoring": false,
    "domain_count": 0,
    "asn_count": 0,
    "prefix_count": 1,
    "ip_count": 0,
    "cdn_count": 0,
    "suppressed": {
      "all": false,
      "categories": []
    },
    "id": "example inventory",
    "cloudzone_count": 0
  }
]
POST /portfolio/inventories
Creates an inventory. Monitoring is enabled and disabled per inventory. IP addresses, ASNs, and prefixes, need to be added into an inventory in order to be monitored. An object can belong to one or more inventories simultaneously. Creating an inventory is the first step.
URI: https://dii.dynapis.com/portfolio/inventories
Legacy URI: https://api.renesys.com/portfolio/inventories
Example Request Body (JSON):
Request to create one inventory named Example Inventory:
[
	{
		"id": "example inventory"

	}
]
Request Body Fields:
- id – The name of the inventory to be created in the format
"id":"inventoryname".
Example Response:
HTTP/1.1 201 Created
DELETE /portfolio/inventories/{inventory}
When you no longer want an inventory and its assets in your portfolio, you need to delete the inventory and the assets it contains. The command is the same for Internet Routing Alerts and Internet Performance Alerts APIs.
NOTE: If you have both Internet Routing Alerts and Internet Performance Alerts, inventories are shared between the two products. If you delete an inventory, neither the inventory nor its contained assets will be available for either product.
URI: https://dii.dynapis.com/portfolio/{inventory}
Legacy URI: https://api.renesys.com/portfolio/{inventory}
Sample URI removing one inventory named your inventory from the portfolio:
https://dii.dynapis.com/portfolio/your%20inventory
Request Body Fields:
- None.
Example Response:
HTTP/1.1 204 No Content
PUT /portfolio/inventories/{inventory} (enable monitoring)
Enable or disable monitoring for an inventory. Updating the contents of an inventory is the same request for Internet Routing Alerts and Internet Performance Alerts APIs.
NOTE: If you have both Internet Routing Alerts and Internet Performance Alerts, inventories are shared between the two products. If you update an inventory, the new inventory contents will be available for both products.
URI: https://dii.dynapis.com/portfolio/{inventory}
Legacy URI: https://api.renesys.com/portfolio/{inventory}
A sample URI for an inventory named “example inventory”: https://dii.dynapis.com/portfolio/example%20inventory
Example Request (JSON):
Must be a JSON object.
{"monitoring": true, "comment": "This is your comment"}
Request Body Fields (JSON):
- monitoring – Enable alerts for this asset. Values can be either
trueorfalse. - comment – User supplied description of the asset.
Example Response:
HTTP/1.1 204 No Content
GET /portfolio/inventories/{inventory}/assets
You can get a list of all inventory assets. The command is the same for Internet Routing Alerts and Internet Performance Alerts APIs.
URI: https://dii.dynapis.com/portfolio/inventories/{inventory}/assets
Legacy URI: https://api.renesys.com/portfolio/inventories/{inventory}/assets
Example URI retrieving the assets in an inventory named “example inventory”:
https://dii.dynapis.com/portfolio/inventories/example%20inventory/assets
Request Body Fields (JSON):
- None.
Example Response (JSON):
The asset list is included in the response in JSON format and contained in the HTTP body of the response. This example shows a specific IP prefix. ASN and IP address assets are included in the response in a similar way.
 [
     {
         "comment": "London Beacon",
         "assetType": "prefix",
         "name": "Beacon Prefix",
         "info":
         {
              "geolocation":
              {
                   "adminsubdiv": "null",
                   "country_code": "GB",
                   "admindiv": "England",
                   "city": "City of London"
              },
              "label": "Reseaux IP Europeens Network Coordination Centre (RIPE NCC)"
         },
         "inventories": ["example inventory"],
         "id": "84.205.65.0/24"
    },
    {
         Similar information for another asset in the inventory
    },
    {
         Similar information for another asset in the inventory
    }
]
GET /portfolio/assets
You can get a list of all assets included in your entire portfolio. These assets may be the IP Prefixes and ASNs for Internet Routing Alerts and/or the IP Addresses for Internet Performance Alerts. The command to retrieve all the assets of the portfolio is the same for both Internet Routing Alerts and Internet Performance Alerts APIs.
URI: https://dii.dynapis.com/portfolio/assets
Legacy URI: https://api.renesys.com/portfolio/assets
Request Body Fields (JSON):
- None.
Example Response (JSON):
The asset list is included in the response in JSON format and contained in the HTTP body of the response.
[
      {
          "comment": "London Beacon",
          "assetType": "prefix",
          "name": "Beacon Prefix",
          "info":
          {
               "geolocation":
               {
                    "adminsubdiv": "null",
                    "country_code": "GB",
                    "admindiv": "England",
                    "city": "City of London"
               },
               "label": "Reseaux IP Europeens Network Coordination Centre (RIPE NCC)"
          },
          "inventories": ["example inventory"],
          "id": "84.205.65.0/24"
     },
     {
          Similar information for another asset in the portfolio
     },
     {
          Similar information for another asset in the portfolio
     }
]
POST /portfolio/assets (add one or multiple assets to an inventory)
Adds one or more assets into an inventory. For an asset to be monitored, it must be added to an inventory. If the inventory does not already exist, it will be created when you add the asset to it. If the inventory already contains the IP address you are adding, your request will be successful even though no action was taken.
URI: https://dii.dynapis.com/portfolio/assets
Legacy URI: https://api.renesys.com/portfolio/assets
Sample Request Body (JSON):
Where add_asset.json contains a JSON array of objects. Both IPv4 and IPv6 samples are shown here. The “name” field is optional.
IPv4 Address Example:
[
     {
          "id": "84.205.64.0/24",
          "name": "Beacon Prefix",
          "comment": "Amsterdam Beacon",
          "inventories": ["example inventory"]
     }
]
Sample request body for to add multiple assets to multiple inventories:
[
     {
          "id": "84.205.71.100",,
          "name": "Sample IP Address 1",
          "inventories": ["example inventory", "second inventory"]
     },

     {
          "id": "2010:500:45:1::1",
          "name": "Sample IPv6 Address",
          "inventories": ["second inventory"]
     },

     {
          "id": "12654",
          "name": "Sample ASN",
          "inventories": ["example inventory"]
     }
]
Request Body Fields (JSON)
id– The ASN, IP prefix, or IP address to be monitored.name– A user defined name for the asset.comment– A user comment.inventories– The inventories the asset will be added.
Example Response:
HTTP/1.1 201 Created
DELETE /portfolio/inventories/{inventory}/assets/{asset}
When you no longer want to monitor an asset, it needs to be removed from the inventory. If the asset belongs to more than one inventory, you can remove it from one inventory, or from all inventories where the asset is found. The command is the same for Internet Routing Alerts and Internet Performance Alerts APIs.
NOTE: If you have both Internet Routing Alerts and Internet Performance Alerts, assets are shared between the two products. Deleting an asset from all inventories will make the asset unavailable for both products.
URI to remove one {asset} from one {Inventory}: https://dii.dynapis.com/portfolio/inventories/{Inventory}/assets/{asset}
Legacy URI to remove one {asset} from one {Inventory}: https://api.renesys.com/portfolio/inventories/{Inventory}/assets/{asset}
URI to remove one asset {asset} from ALL inventories: https://dii.dynapis.com/portfolio/assets/{asset}
Legacy URI to remove one asset {asset} from ALL inventories: https://api.renesys.com/portfolio/assets/{asset}
URI remove ALL assets from one {Inventory}: https://dii.dynapis.com/portfolio/inventories/{Inventory}/assets
Legacy URI remove ALL assets from one {Inventory}: https://api.renesys.com/portfolio/inventories/{Inventory}/assets
Request Body Fields (JSON):
None.
Example Response:
HTTP/1.1 204 No Content
Configure Performance Monitoring
POST /portfolio/performance/inventories/{Inventory}
Enables or disable monitoring for all IP addresses in the inventory. In order for performance monitoring and alerts to occur for any IP address, the address needs to be added to an inventory and monitoring needs to be enabled for that inventory.
URI: https://dii.dynapis.com/portfolio/performance/inventories/{Inventory}
Legacy URI: https://api.renesys.com/portfolio/performance/inventories/{Inventory}
Example for enabling monitoring on an inventory named “example inventory”:
https://dii.dynapis.com/portfolio/performance/inventories/example%20inventory
Request Body Example (JSON):
@update-inventory-settings.json
{
     "monitor": true
}
Request Body Fields (JSON):
monitor– Identifies if inventory is monitored. Valid values: True or False
Example Response:
HTTP/1.1 204 No Content
PUT /portfolio/performance/assets/{IP} (add collector)
Assigns alert thresholds for one or more collectors to the specified IP address. Each monitored IP address needs its own file of alert thresholds. Configure the Internet Performance Alerts thresholds for an IP address by first getting the current collectors information using Get Current Internet Performance Alerts Collectors (API).
NOTE: When you use this request, you are replacing the threshold information for this IP address. Make sure to include ALL performance alert thresholds in the file, the new alert thresholds and the ones staying the same. Remove thresholds you no longer want for this IP address.
URI: https://dii.dynapis.com/portfolio/performance/assets/{IP}
Legacy URI: https://api.renesys.com/portfolio/performance/assets/{IP}
Example for adding thresholds(s) for an IP address in a monitored Inventory:
https://dii.dynapis.com/portfolio/performance/assets/84.205.64.0/24
Example Request Body (JSON):
Assign a list of collectors as configure-ip.json:
[
  {
    "collector": "rack-london",
    "latency_fixed": 50,
    "packetloss_percent": 30,
    "traceroutes": true

  },
  {
    "collector":"aws-san-francisco-us-west-1c",
    "latency_fixed": 30,
    "packetloss_percent": 10,
    "traceroutes": false
  }
]
This example shows the currently assigned collectors for the IP address, retrieved using the Get Current Internet Alerts – Performance Collectors (API) request. If you are setting collector thresholds for the first time on this IP address, the response fields will be null.
To set thresholds for another collector, edit the settings to include the information for the additional collector and use this request to replace the current configure-ip.json. You are replacing the settings that already exist. No threshold collectors will change until you use this command to replace it.
Request Body Fields (JSON):
collector– The name of the collector, usually identified by type of collector and location. Types of collectors can include AWS (Amazon Web Services), RACK (Rackspace), DO (Digital Ocean), SOFT (Softlayer), GCE (Google Compute Engine), etc.latency_fixed– The latency threshold in milliseconds. An alert is raised if the collector measures latency (PING time) that exceeds this number of milliseconds.packetloss_percent– The packet loss rate as a percent of packets. An alert is raised if the collector measures packet loss that exceeds this percentage of packet loss.traceroutes– Indicates whether you want to collect data for traceroute reports in the future. Default is ‘false’.
In the example response above, when both measures are set, an alert is raised if the rack-london collector measures latency (PING time) that exceeds 50 ms OR the packet loss rate exceeds 30%.
Example Response:
HTTP/1.1 204 No Content
DELETE /portfolio/performance/assets/{IP} (remove collector)
Removes all monitoring for the specified IP address. Each monitored IP address needs its own file of alert thresholds. Configure the Internet Performance Alerts thresholds for an IP address by first getting the current collectors information using Get Current Internet Performance Alerts Collectors (API). Edit the information to change, add, or remove current collector thresholds.
URI: https://dii.dynapis.com/portfolio/performance/assets/{IP address}
Legacy URI: https://api.renesys.com/portfolio/performance/assets/{IP address}
Request Body Fields (JSON):
- None.
Example Response:
There is no response on a successful delete request other than the following header:
HTTP/1.1 204 No Content
GET /portfolio/performance/collectors
Retrieves a list of available collectors. Dyn monitors the performance of network assets from collectors around the world. Each collector is named after its provider and location, e.g. “aws-tokyo” or “gce-council-bluffs”. Use this request to get a list of available collectors. Select one or more collectors for each IP address to monitor. If more than one IP address exists in the inventory, you must assign the collectors individually.
URI: https://dii.dynapis.com/portfolio/performance/collectors
Legacy URI: https://api.renesys.com/portfolio/performance/collectors
Request Body Fields (JSON):
- None
Example Response (JSON):
HTTP/1.1 200 OK
Date: Wed, 01 Apr 2015 20:47:02 GMT
Server: TornadoServer/4.0.2
Content-Type: application/json
Content-Length: 0
Vary: Accept-Encoding
Connection: close

[
  {"name": "aws-san-francisco-us-west-1c", "label": "AWS San Francisco Zone C"},
  {"name": "do-new-york", "label": "Digital Ocean New York"},
  {"name": "rack-london", "label": "Rackspace London"}
]
Response Fields (JSON):
name– The identified collector.label– The type of collector and its location.
GET /portfolio/performance/assets/{IP}
Use this request to see the current collector configuration for this IP address. Retrieve the current settings before you update them using Configure (Update) Internet Performance Alerts (API).
URI: https://dii.dynapis.com/portfolio/performance/assets/{IP}
Legacy URI: https://api.renesys.com/portfolio/performance/assets/{IP}
Request Body Fields (JSON):
- None
Example Response (JSON):
This sample JSON response displays an example of the current Internet Performance Alerts configuration for the IP address.
NOTE: If you are setting collector thresholds for the first time on this IP address, the response will return the HTTP code 404.
[
  {
    "collector": "rack-london",
    "latency_fixed": 50,
    "packetloss_percent": 30,
    "traceroutes": true

  },
  {
    "collector":"aws-san-francisco-us-west-1c",
    "latency_fixed": 30,
    "packetloss_percent": 10,
    "traceroutes": false

  }
]
NOTE: In the example response above, when both measures are set, an alert is raised if the rack-london collector measures latency (PING time) that exceeds 50 ms OR the packet loss rate exceeds 30%.
Response Fields (JSON):
collector– The name of the collector, usually identified by type of collector and location. Types of collectors can include AWS (Amazon Web Services), RACK (Rackspace), DO (Digital Ocean), SOFT (Softlayer), GCE (Google Compute Engine), etc.latency_fixed– The latency threshold in milliseconds. An alert is raised if the collector measures latency (PING time) that exceeds this number of milliseconds.packetloss_percent– The packet loss rate as a percent of packets. An alert is raised if the collector measures packet loss that exceeds this percentage of packet loss.traceroutes– Indicates whether you want to collect data for traceroute reports in the future. Default is ‘false’.
PUT /portfolio/performance/settings
Changes the Performance Alerts email settings. Toggle alert notification emails on or off, or change the email address that receives the email alert notifications.
URI: https://dii.dynapis.com/portfolio/performance/settings
Legacy URI: https://api.renesys.com/portfolio/performance/settings
Example Request Body (JSON):
{
  "email_address":"youraddress@example.com",
  "send_email":true
}
Request Body Fields (JSON):
- @replace-settings.json
email_address– Defaults to the email address on your Internet Intelligence user account (if any). You can leave this field blank to accept the default, or enter an email address if you want the Performance Alerts going to a different address.send_email– Defaults to false. Valid Values: false or true.
Example Response:
HTTP/1.1 204 No Content
GET /portfolio/performance/settings
Retrieves current email settings for your Internet Intelligence account. Toggle alert notification emails on or off, or change the email address that receives the email alert notifications.
URI: https://dii.dynapis.com/portfolio/performance/settings
Legacy URI: https://api.renesys.com/portfolio/performance/settings
Request Body Fields (JSON):
- None
Example Response (JSON):
{
     "email_address":  "user@example.com",
     "send_email":  false
}
Response Fields (JSON):
email_address– Defaults to the email address on your Internet Intelligence user account (if any). You can leave this field blank to accept the default, or enter an email address if you want the email alerts going to a different address.send_email– Indicates if alerts will be sent. Valid Values: false or true.
GET /portfolio/performance/plot/{IP}/{collector_set}
Retrieves the past 4 hours of latency and packet loss history and displays it as a graph. This call allows you to view recent measurements to a given target without having to first trigger an alert. It can help find the right thresholds to configure an alert or track a high value end point.
URI https://dii.dynapis.com/portfolio/performance/plot/{IP}/{collector_set}
Legacy URI: https://api.renesys.com/portfolio/performance/plot/{IP}/{collector_set}
Where
{IP} – a single IP address
{collector_set} – the collector name where the performance is measured. See Get Available Internet Performance Alerts Collectors to get a listing of all available collectors.
Request Body Fields (JSON):
- None
Example Response:
The alert information is included in the response in raw PNG format and contained within the HTTP body of the response. Here is an example of a latency and packet loss plot:
HTTP/1.1 200 OK
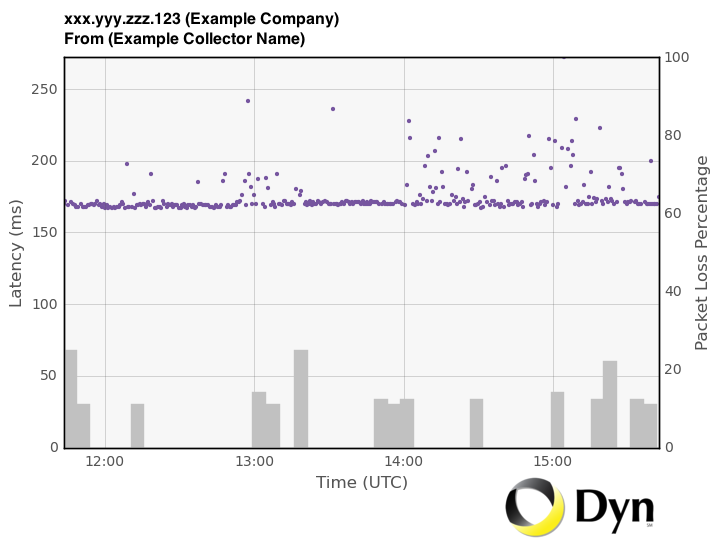
NOTE: There is no Threshold line on this graph because a threshold has not yet been set for this IP address. The dots represent individual latency measures, which use the scale at the left of the graph.
NOTE: The alert information is included in the response in raw PNG format and contained within the HTTP body of the response.To quickly view the graph, make the call through your browser.
Packet Loss percentages appear as vertical bar graph objects and are measured on the scale at the right of the graph.
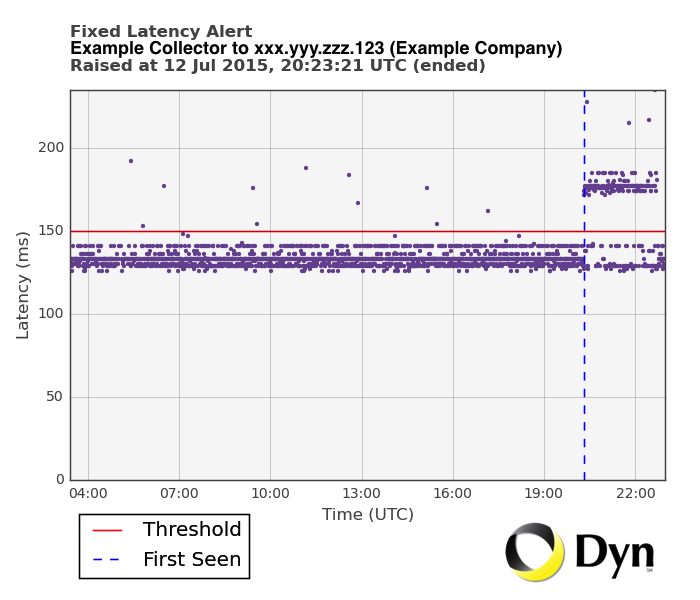
GET /portfolio/performance/alert/plot/{alarmid}
Retrieves graphing plot for the specified performance alert. When you receive a Performance Alert notification email, you can use the API to programmatically retrieve the visualization graph included in the email notification you received. This API call allows you to pull visualizations into existing monitoring dashboards. The image is returned as a raw PNG.
URI: https://dii.dynapis.com/portfolio/performance/alert/plot/{alarmid}
Legacy URI: https://api.renesys.com/portfolio/performance/alert/plot/{alarmid}
Where {alarmid} is the numerical id for the specific alert.
Request Body Parameters (JSON):
- None
Example Response:
The alert information is included in the response in raw PNG format and contained within the HTTP body of the response. Here is an example of a latency plot:
GET /portfolio/performance/alert/data/{alarmid}
Retrieves JSON data for the alert identified. When you receive a Performance Alert notification email, you can use the API to programmatically retrieve the data that created the plot. This API call allows you to pull JSON formatted data that created the plot. The request will return 404 error if the alarm ID entered is not a valid alert or will return 400 error if the alarm ID entered is not a valid performance alert.
URI: https://dii.dynapis.com/portfolio/performance/alert/data/{alarmid}/
Legacy URI: https://api.renesys.com/portfolio/performance/alert/data/{alarmid}/
Request Body Fields (JSON):
- None
Example Response (JSON):
The alert data is included in the response in JSON format. See Alerts Output for information on the output for each type of alert.
GET /portfolio/performance/alert/data/3630537 HTTP/1.1

HTTP/1.1 200 OK
Content-Type: application/json
{
  "alarmType": "Fixed Latency",
  "ip": "218.6.14.226",
  "ipLabel": "CHINANET fujianprovince network",
  "collectorLabel": "Digital Ocean Amsterdam 3",
  "threshold": 260,
  "firstSeen": 1455847919,
  "raisedAt": 1455848413,
  "loweredAt": 1455853980,
  "measurements": [
    [
      1455833544,
      290
    ],
    [
      1455833592,
      269
    ],
  ]
}
NOTE: NULL in any of the data sets does NOT represent no data. NULL in this instance represents a failure of packetloss collection. These packetloss failures are calculated into the decision as to when an alert is raised for the packetloss percentage crossing the collector threshold.
Response Body Fields (JSON):
ip– The identified IP address for the data.ipLabel– Additional collector information for the IP address.alarmType– Identifies the type of alert. See Alert Categories and Types for information on each of the alert types possible.collectorLabel– Human readable version of the alert’s Collector Set.threshold– Identifies the collector threshold set to trigger an alert. Latency is set in milliseconds. Packetloss is set as a percentage.raisedAt– Timestamp (Epoch Unix format) marking when the alert was raised.firstSeen– Timestamp (Epoch Unix format) marking when the alert was first detected.loweredAt– Timestamp (Epoch Unix format) marking when the alert was lowered.measurements– pairs of data [timestamp (Epoch Unix format), the performance measurement in milliseconds].
GET /portfolio/performance/alert/traceroutes/{alert_id}
Retrieves up to two traceroute paths around (before and after) the alert. The pre-alert traceroute relies on continuous monitoring of the alerting IP address; Internet Intelligence selects the latest traceroute that happened at least 5 minutes prior to the first evidence of the alert.
NOTE: To monitor your assets using traceroutes, make sure to enable traceroutes for your collectors.
URI: https://dii.dynapis.com/portfolio/performance/alert/traceroutes/{alert_id}
Legacy URI: https://api.renesys.com/portfolio/performance/alert/traceroutes/{alert_id}
Request Body Fields (JSON):
- None
Example Response (JSON):
There are two traceroute paths, one at least 5 minutes before the first evidence of the alert and one at or after the first evidence time of the alert.
{
  “_items": [
    {
      "hops": [
        {
          "ip": "54.239.122.95",
          "reply_ttl": 249,
          "mpls_labels": "",
          "rtt": 1460,
          "city": "Seoul",
          "country_code": "KR",
          "label": "Amazon.com, Inc.",
          "asn": 16509
        },
        {
          "ip": "110.4.80.245",
          "reply_ttl": 44,
          'mpls_labels": "",
          "rtt": 38120,
          "city": "Seoul",
          "country_code": "KR",
          "label": "HCLC",
          "asn": 38661
        }
      ],
      "timestamp": 1467075230,
      "relation": "before",
      "ip": "110.4.80.245",
      "collector_set": "aws-seoul-ap-northeast-2C"
    },
    {
      "hops": [
        {
          "ip": "54.239.122.95",
          "reply_ttl": 249,
          "mpls_labels": "",
          "rtt": 1472,
          "city": "Seoul",
          "country_code": "KR",
          "label": "Amazon.com, Inc.",
          "asn": 16509
        }
      ],
      "timestamp": 1467076172,
      "relation": "after",
      "ip": "110.4.80.245",
      "collector_set": "aws-seoul-ap-northeast-2C"
    }
  ]
}
Response Fields (JSON):
timestamp: Timestamp of the traceroute in POSIX format.relation: Temporal relationship of this traceroute to the alert specified by {alert_id}, either before or after.
ip: String specifying the target IP of the traceroute.
collector_set: String identifying the collector set.hops(array of objects representing hops in the traceroute path):
ip: String identifying the ip of the hop or ‘no reply’.reply_ttl: Integer specifying the reply TTL in milliseconds.mpls_labels: JSON object representing MPLS tunnels.rtt: Integer specifying the round trip time (RTT) in milliseconds.city: Geolocation city data for the hop.admindiv: Geolocation administrative division for hop (for United States and Canada).country_code: Geolocation country data for hop.label: IP labelasn: Integer representing ASN.
GET /portfolio/performance/traceroutes/latest/{ip}/{collectorset}
Retrieves the most recent traceroute path for the specified IP address and collector set. Returns a 404 error if no traceroutes are available. If you have continuous monitoring set on an IP address, you can request the most recent traceroute path for that IP address based on a collector set you have monitoring the address.
NOTE: To monitor your assets using traceroutes, make sure to enable traceroutes for your collectors.
URI: https://dii.dynapis.com/portfolio/performance/traceroutes/latest/{ip}/{collectorset}
Legacy URI: https://api.renesys.com/portfolio/performance/traceroutes/latest/{ip}/{collectorset}
Request Body Fields (JSON):
- None
Example Response (JSON):
{
  “_items": [
    {
      "hops": [
        {
          "ip": "54.239.122.95",
          "reply_ttl": 249,
          "mpls_labels": "",
          "rtt": 1460,
          "city": "Seoul",
          "country_code": "KR",
          "label": "Amazon.com, Inc.",
          "asn": 16509
        },
        {
          "ip": "110.4.80.245",
          "reply_ttl": 44,
          'mpls_labels": "",
          "rtt": 38120,
          "city": "Seoul",
          "country_code": "KR",
          "label": "HCLC",
          "asn": 38661
        }
      ],
      "timestamp": 1467075230,
      "relation": "before",
      "ip": "110.4.80.245",
      "collector_set": "aws-seoul-ap-northeast-2C"
    },
    {
      "hops": [
        {
          "ip": "54.239.122.95",
          "reply_ttl": 249,
          "mpls_labels": "",
          "rtt": 1472,
          "city": "Seoul",
          "country_code": "KR",
          "label": "Amazon.com, Inc.",
          "asn": 16509
        }
      ],
      "timestamp": 1467076172,
      "relation": "after",
      "ip": "110.4.80.245",
      "collector_set": "aws-seoul-ap-northeast-2C"
    }
  ]
}
The traceroutes are included in the response in JSON format and contained in the HTTP body of the response.
Response Fields (JSON):
timestamp: Timestamp of the traceroute in POSIX format.ip: String specifying the target IP of the traceroute.collector_set: String identifying the collector set.hops(array of objects representing hops in the traceroute path):ip: String identifying the ip of the hop or ‘no reply’.reply_ttl: Integer specifying the reply TTL in milliseconds.mpls_labels(json): JSON object representing MPLS tunnels.rtt: Integer specifying the round trip time (RTT) in milliseconds.
city: Geolocation city data for the hop.
admindiv: Geolocation administrative division for hop (for United States and Canada).country_code(string): Geolocation country data for hop.label: IP labelasn: Integer representing ASN.
GET /portfolio/performance/traceroutes/historical/{IP}/{collectorset}
Retrieves the most recent traceroute path for the specified IP address and collector set. Returns a 404 error if no traceroutes are available. Traceroute data is only kept for four days from the current time.
NOTE: To monitor your assets using traceroutes, make sure to enable traceroutes for your collectors.
URI: https://dii.dynapis.com/portfolio/performance/traceroutes/historical/{ip}/{collectorset}
Legacy URI: https://api.renesys.com/portfolio/performance/traceroutes/historical/{ip}/{collectorset}
Request Parameters:
start(int) – Get traceroute paths measured after this time. Timestamp needs to be in POSIX format. Default is 4 hours prior to the value ofend. If bothstartandendtimes are specified, it will return all traceroutes between the start and end times.end(int) – Get traceroute paths measured before this time. Timestamp needs to be in POSIX format. Default is the current time. If only theendtime is specified, it will return the 4 hours of traceroute paths prior to theendtime. If bothstartandendtimes are specified, it will return all traceroutes between the start and end times.
Request Body Fields (JSON)
-
None.
Example Response (JSON):
{
  "_items": [
    {
      "timestamp": 1467075230,
      "ip": "110.4.80.245",
      "collector_set": "aws-seoul-ap-northeast-2c",
      "hops": [
        {
          "city": "Seoul",
          "reply_ttl": 251,
          "mpls_labels": "",
          "ip": "54.239.122.39",
          "label": "Amazon.com, Inc.",
          "rtt": 1926,
          "country_code": "KR",
          "asn": 16509
        },
        {
          "city": "",
          "reply_ttl": 247,
          "mpls_labels": "303695",
          "ip": "54.239.122.244",
          "label": "Amazon.com, Inc.",
          "rtt": 8791,
          "country_code": "JP",
          "asn": 16509
        },
        [...more hops...]
      ]
    },
    {
      "timestamp": 1467075230,
      "ip": "110.4.80.245",
      "collector_set": "aws-seoul-ap-northeast-2c",
      "hops": [
        {
          "city": "Seoul",
          "reply_ttl": 241,
          "mpls_labels": "",
          "ip": "116.125.39.133",
          "label": "SK Broadband",
          "rtt": 11136,
          "country_code": "KR",
          "asn": 38661
        },
        {
          "city": "Seoul",
          "reply_ttl": 48,
          "mpls_labels": "",
          "ip": "110.4.80.245",
          "label": "HCLC",
          "rtt": 3915,
          "country_code": "KR",
          "asn": 38661
        },
        [...more hops...]
      ]
    },
    [...more traceroutes...]
  ]
}
The traceroutes are included in the response in JSON format and contained in the HTTP body of the response.
_items: An array of traceroute objects.timestamp: Timestamp in POSIX format. If no timestamps are specified it will return the prior 4 hours of traceroute paths.ip: String identifying the ip of the hop or ‘no reply’.collector_set(string): String identifying the collector set.hops(array of objects representing hops in the traceroute path):reply_ttl: Integer specifying the reply TTL in milliseconds.mpls_labels: JSON object representing MPLS tunnels.rtt: Integer specifying the round trip time (RTT) in milliseconds.city: Geolocation city data for the hop.admindiv: Geolocation administrative division for hop (for United States and Canada).country_code: Geolocation country data for hop.label: IP labelasn: Integer representing ASN.
GET /portfolio/performance/data/{ip}/{collectorset}
Retrieves the last four hours of latency data between an IP address and a collector set. The data itself is returned in the measurements field as a POSIX timestamp and latency measurement.Traceroute data is only kept for four days from the current time.
URI: https://dii.dynapis.com/portfolio/performance/data/{ip}/{collectorset}
Legacy URI: https://api.renesys.com/portfolio/performance/data/{ip}/{collectorset}
Request Parameters:
start(int) – Get traceroute paths measured after this time. Timestamp needs to be in POSIX format. Default is 4 hours prior to the value ofend. If bothstartandendtimes are specified, it will return all traceroutes between the start and end times.end(int) – Get traceroute paths measured before this time. Timestamp needs to be in POSIX format. Default is the current time. If only theendtime is specified, it will return the 4 hours of traceroute paths prior to theendtime. If bothstartandendtimes are specified, it will return all traceroutes between the start and end times.
Request Body Fields:
- None
Example Response (JSON):
{
  "ip":"218.6.14.226",
  "ipLabel":"CHINANET fujianprovince network",
  "collectorLabel":"Digital Ocean Amsterdam 3",
  "measurements":[
    [
      1455833544,
      290
    ],
    [
      1455833592,
      269
    ]
  ]
}
Response Fields (JSON):
ip– The identified IP address for the data.ipLabel– Additional collector information for the IP address.measurements– Pairs of data [timestamp (POSIXx format), the performance measurement in milliseconds].timestamp– The time the measurement was taken in POSIX format.latency– The latency measurement in milliseconds.
collectorLabel – Human readable version of the data’s collector set.
Manage Your Alerts
GET /portfolio/monitoring/alerts
You can get a list of all Internet Routing Alerts and Internet Performance Alerts. Each Internet Alert has its own output content. See Alerts Output for information on the output for the various Internet Alert types. See Alert Categories and Types for a listing of available alert categories.
NOTE: Alerts will be deleted 180 days after they were raised.
URI: https://dii.dynapis.com/portfolio/monitoring/alerts
Legacy URI: https://api.renesys.com/portfolio/monitoring/alerts
Request Parameters:
fields– List of fields to include in the search of your alerts. You can specify multiple fields either in a comma-separated list, or with multiple occurrences of parameter:fields=a,b,cis equivalent tofields=a&fields=b&fields=corfields=a,b&fields=calarmId– The specific ID number given to an alert.type– Type of asset being monitored.asset.assetName– Name of asset.asset.assetType– The type of asset.asset.inventories– Inventories the asset resides in.
limit– Retrieve no more than a specified number of alerts, up to 1000 alerts.alarmId– Request a specific alert via itsalarmId.type– Request the alerts by a specific type. Learn more about alert category and types.category– Request the alerts by a specific category. Learn more about alert category and types.firstEvidenceAt– Request alerts whose first evidence was seen at the specified time (POSIX timestamp).raisedAt– Request alerts that were raised at a specified time (POSIX timestamp).loweredAt– Get alerts lowered at a specific time (POSIX timestamp).acknowledgedAt– Get alerts that were acknowledged at a specific time (POSIX timestamp).acknowledgeType– Get alerts that were acknowledged by a specified means. Valid acknowledgement types:user,suppress.asset– Get alerts for a specified asset within your Portfolio.prefix– Get alerts for a specified IP prefix.origin– Get alerts for a specified ASN.ip– Get alerts for a specified IP address.cloudzone– Get alerts for a specified cloudzone.cdn– Get alerts for a specified CDN.
Sample URI that searches for alerts of a specific type from a specific user ID and asset: https://dii.dynapis.com/portfolio/monitoring/alerts?type=latency-fixed&ip=54.43.32.21
Request Body:
- None
NOTE: If you do not include the limit request parameter, this response will be truncated to the first 1000 matching alerts. Truncated responses are accompanied by a “303 See Other” status code. The response includes a Link header (defined by RFC 5988) that lets you retrieve the next batch of 1000 matching alerts. If you want to retrieve all matching alerts, you will need to page through them by following successive the Link headers.
Example Request Using “next” Link:
Example of a truncated response:
GET /portfolio/monitoring/alerts?fields=alarmId HTTP/1.1

HTTP/1.1 303 See Other
Content-Type: application/json
Link: <?fields=alarmId&alarmId.lt=23676227>; rel="next"
Location: ?fields=alarmId&alarmId.lte=28639336&limit=1000

[...JSON array of the first 1000 matching alarms...]
To retrieve the next page of results, look for the Link header with rel="next". Extract the relative URI reference from inside the angle brackets (“<>“). Resolve it according to RFC 3986 section 5, using the retrieval URI (“/monitoring/alerts?fields=alarmId”) as the base URI. The request to retrieve the next page will then look like:
GET /portfolio/monitoring/alerts?fields=alarmId&alarmId.lt=23676227

HTTP/1.1 303 See Other
Content-Type: application/json
Link: <?fields=alarmId&alarmId.lt=19937864>; rel="next"
Location: ?fields=alarmId&alarmId.lte=23676223&limit=1000

[...JSON array of the next 1000 matching alerts...]
When you reach the last page of results, you will receive a “200 OK” response with no Link header:
GET /portfolio/monitoring/alerts?fields=alarmId&alarmId.lt=1056246 HTTP/1.1

HTTP/1.1 200 OK
Content-Type: application/json

[...JSON array of < 1000 remaining alerts...]
Example Response (JSON):
See Alerts Output for information on the output for each type of alert.
Example of an outage alert response:
[
  {
    "acknowledgeType":"archived",
    "loweredAt":1411023217,
    "peerCount":210,
    "firstEvidenceAt":1410756954,
    "prefix":"23.53.192.0/20",
    "updatedAt":1435764223,
    "acknowledgedAt":1435764223,
    "category":"outage",
    "raisedAt":1410776838,
    "alarmId":85688,
    "asset":"23.53.192.0/20",
    "type":"outage",
    "userName":"example@sample.com",
    "typeName":"outage"
  }
]
GET /portfolio/monitoring/alerts (unacknowledged)
You can get a list of all unacknowledged alerts, both from Internet Routing Alerts and Internet Performance Alerts. Each alert’s output format is basically the same, but the output fields vary by the alert type. See Alerts Output for information on the output fields for the various alert types.
URI:
Retrieve all unacknowledged Monitoring alerts:
https://dii.dynapis.com/portfolio/monitoring/alerts?acknowledgedAt.is_null=
Legacy URI: https://api.renesys.com/portfolio/monitoring/alerts?acknowledgedAt.is_null=
Retrieve all unacknowledged Performance alerts:
https://dii.dynapis.com/portfolio/monitoring/alerts?acknowledgedAt.is_null=&category=performance
NOTE: See Alert Categories and Types for the valid values to retrieve unacknowledged alerts of any specific category.
Request Body Fields (JSON):
- None
Example Response (JSON)
See Alerts Output for information on the output for each type of alert.
Here is an example of an unacknowledged alert of unexpected subprefix activity:
{
"origin": 10794,
"acknowledgeType": null,
"loweredAt": null,
"peerCount": 373,
"firstEvidenceAt": 1468933449,
"prefix": "171.128.0.0/10",
"updatedAt": 1468933864,
"acknowledgedAt": null,
"category": "unexpected-activity",
"raisedAt": 1468933449,
"validOrigins": [],
"alarmId": 13796613,
"asset": "171.128.0.0/10",
"type": "unexpected-subprefix-activity",
"subprefix": "171.161.53.0/24",
"userName": "example@email.com",
"typeName": "unexpected-subprefix-activity",
"previousOrigin": null
},
GET /portfolio/monitoring/alerts (for a specific asset)
You can get a list of all monitoring alerts for a single asset. Each alert has its own output content. See Alerts Output for information on the output for each type of alert.
URI: https://dii.dynapis.com/portfolio/monitoring/alerts?asset={asset}
Legacy URI: https://api.renesys.com/portfolio/monitoring/alerts?asset={asset}
Example request to retrieve alerts for a specific IP prefix:
https://dii.dynapis.com/portfolio/monitoring/alerts?asset=84.205.69.0/24
Example request to retrieve alerts for a specific ASN:
https://dii.dynapis.com/portfolio/monitoring/alerts?asset=12654
Request Body Fields (JSON):
- None
Example Response (JSON):
Here is an example of retrieving alerts for the prefix asset: 171.181.112.0/24
{
"origin": 19886,
"acknowledgeType": "archived",
"loweredAt": 1432318734,
"peerCount": 0,
"firstEvidenceAt": 1432247096,
"prefix": "171.181.112.0/24",
"updatedAt": 1435764223,
"acknowledgedAt": 1435764223,
"category": "unexpected-activity",
"raisedAt": 1432247096,
"validOrigins": [],
"alarmId": 769458,
"asset": "171.181.112.0/24",
"type": "unexpected-prefix-activity",
"userName": "example@sample.com",
"typeName": "unexpected-prefix-activity",
"previousOrigin": null
}
GET /portfolio/monitoring/types
Retrieves a list of alert types. See Alerts Output by Type for more information on the information contained in each alert.
URI: https://dii.dynapis.com/portfolio/monitoring/types
Legacy URI: https://api.renesys.com/portfolio/monitoring/types
Request Body Fields (JSON):
- None
Example Response (JSON):
[
  "hijack",
  "outage",
  "instability",
  "leak",
  "unexpected-activity",
  "upstream",
  "performance",
  "cloudzone",
  "cdn"
]
GET /portfolio/monitoring/alerts/{alarmid} (details by alert ID)
Retrieves the details for the identified alert. When you receive a Routing or Performance Alert notification email, you can use the Alert's Alarm ID (inside the email) to retrieve the details about the alert through the API, including information on when the issue was first seen, the time the alert was raised, and the current monitoring threshold that was crossed. This information can be used to better understand the context around the alert notification. See Alerts Output for information on the output for the various Internet Alert types.
URI https://dii.dynapis.com/portfolio/monitoring/alerts/{alarmid}
Legacy URI: https://api.renesys.com/portfolio/monitoring/alerts/{alarmid}
Request Body Fields (JSON):
- None
Example Response (JSON):
See Alerts Output for information on the output for each type of alert.
{
  "acknowledgeType": null,
  "loweredAt": 1480514730,
  "peerCount": 46,
  "firstEvidenceAt": 1480514470,
  "prefix": "84.205.64.0/24",
  "updatedAt": 1480514764,
  "acknowledgedAt": null,
  "category": "instability",
  "raisedAt": 1480514460,
  "alarmId": 24631168,
  "asset": "84.205.64.0/24",
  "type": "instability",
  "userName": "7a002f3b-16d1-4e3b-aff6-b078beb14f9c",
  "typeName": "instability"
}
POST /portfolio/monitoring/bulkAcknowledge (all)
Acknowledge all alerts. Alerts remain active until acknowledged. You can all acknowledge alerts at once using this command. See Alert Categories and Types for a listing of available alert categories.
URI https://dii.dynapis.com/portfolio/monitoring/bulkAcknowledge
Legacy URI: https://api.renesys.com/portfolio/monitoring/bulkAcknowledge
Request Body Fields (JSON):
- None
Example Response:
HTTP/1.1 204 No Content
POST /portfolio/monitoring/bulkAcknowledge (one asset)
Acknowledge an alert from one asset. Alerts remain active until acknowledged. See Alert Categories and Types for a listing of available alert categories.
URI: https://dii.dynapis.com/portfolio/monitoring/bulkAcknowledge?asset={asset}
Legacy URI: https://api.renesys.com/portfolio/monitoring/bulkAcknowledge?asset={asset}
Example for acknowledging alerts for an ASN:
https://dii.dynapis.com/portfolio/monitoring/bulkAcknowledge?asset=12654
Request Body Fields (JSON):
- None
Example Response:
HTTP/1.1 204 No Content
POST /portfolio/monitoring/bulkAcknowledge (one type)
Acknowledge all alerts of one type. Alerts remain active until acknowledged. See Alert Categories and Types for a listing of available alert categories.
URI: https://dii.dynapis.com/portfolio/monitoring/bulkAcknowledge?typeName={alarm type}
Legacy URI: https://api.renesys.com/portfolio/monitoring/bulkAcknowledge?typeName={alarm type}
Example URI acknowledging one type of alert (outage):
https://dii.dynapis.com/portfolio/monitoring/bulkAcknowledge?typeName=outage
Response Body Fields (JSON):
- None
Example Response:
HTTP/1.1 204 No Content
POST /portfolio/monitoring/bulkAcknowledge (one type, one asset)
Acknowledge one type of alert for one asset. Alerts remain active until acknowledged. See Alert Categories and Types for a listing of available alert categories.
URI: https://dii.dynapis.com/portfolio/monitoring/bulkAcknowledge?{asset type}={prefix}&typeName={alert type}
Legacy URI: https://api.renesys.com/portfolio/monitoring/bulkAcknowledge?{asset type}={prefix}&typeName={alert type}
Example URI acknowledging outage on a specific IP prefix:
https://dii.dynapis.com/portfolio/monitoring/bulkAcknowledge?prefix=84.205.64.0/24&typeName=outage
Example URI acknowledging instability on a specific IP prefix:
https://dii.dynapis.com/portfolio/monitoring/bulkAcknowledge?asn=84.205.64.0/24&typeName=instability
Response Body Fields (JSON):
- None
Example Response:
HTTP/1.1 204 No Content
PUT /portfolio/inventories/{inventory} (enable or disable alerts)
Enable or disable alerts for an inventory. Updating the contents of an inventory is the same request for Internet Routing Alerts and Internet Performance Alerts APIs.
NOTE: If you have both Internet Routing Alerts and Internet Performance Alerts, inventories are shared between the two products. If you update an inventory, the new inventory contents will be available for both products.
URI: https://dii.dynapis.com/portfolio/{inventory}
Legacy URI: https://api.renesys.com/portfolio/{inventory}
A sample URI for an inventory named "example inventory": https://dii.dynapis.com/portfolio/example%20inventory
Example Request (JSON):
Must be a JSON object.
{"monitoring": true, "comment": "This is your comment"}
Request Body Fields (JSON):
- monitoring – Enable alerts for this asset. Values can be either
trueorfalse. - comment – User supplied description of the asset.
Example Response:
HTTP/1.1 204 No Content