The Origin/Upstream plot API request brings you a graphic representation of the BGP activity for the given alert. For more information on the types of alerts and alert plots, see Alert Categories and Types
Syntax
| Click to view all Internet Alerts – Routing API Resources |
| GET /portfolio/routing/alert/plot/{alertid} — Retrieves origin and upstream data plot for the alert. NOTE: Only available for hijack and outage alert types. cURL example for retrieving the alert plot:
Where {alertid} is the numerical id for the alert. |
| Arguments: None. |
| Response: The origin / upstream plot for the identified alert. |
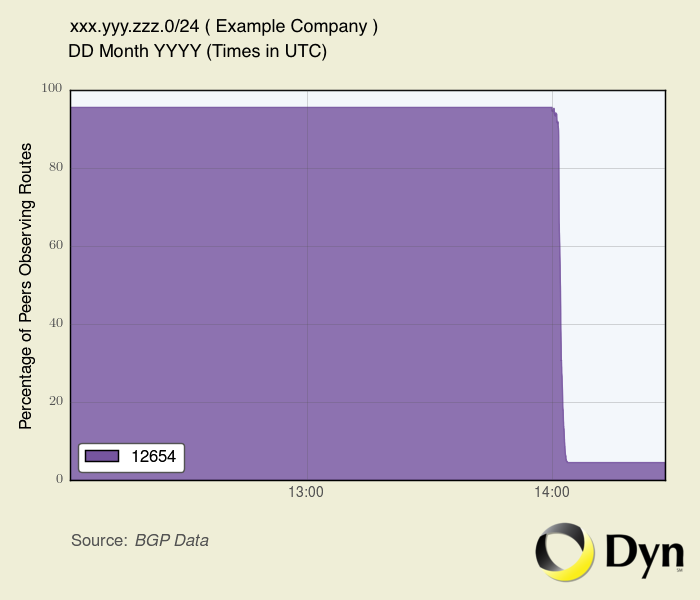
Two example plots of an outage. The first is the prefix’s plot during the outage, showing a lower percentage of peers observing routes for the identified ASN 12654. The second plot shows the percentage of peers observing routes returning to the pre-outage levels.
For more information on the types of alerts and alert plots, see Alert Categories and Types |