Use the Explore Internet Performance feature to examine up to three months of historic latency information, as well as path and latency measurements during the past 24 hours.
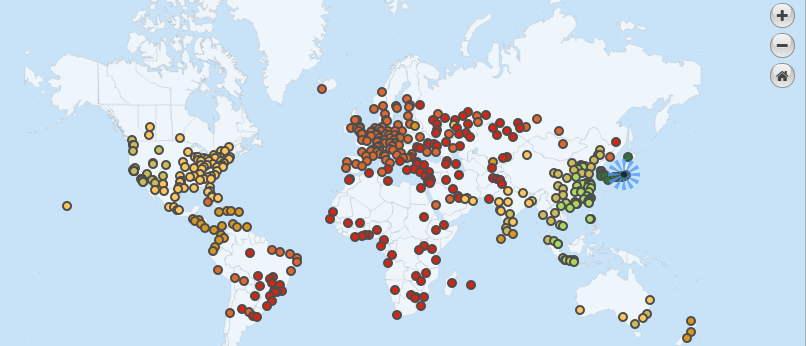
The Explore Performance page provides an overview of latencies between vantage point collectors and customers in market cities. Select a vantage point and market on the left to view the performance in the map on the right.
| For more details on Internet Performance between vantage points and a specific market location, see the help topics Traversed Path, which displays the individual network hops between the endpoints, and Latency Measurements, which displays the latency delay between the endpoints. | |
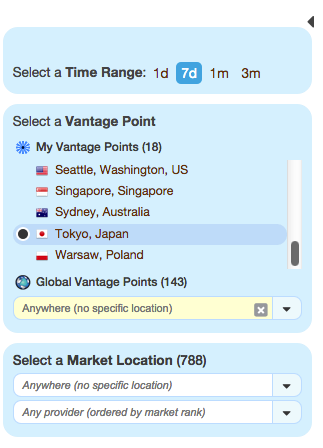
| Select a Time Range – The length of performance history to display. Options are 1 day, 7 days, 1 month, or 3 months.
Select a Vantage Point – Any global vantage point can be used. This example shows Tokyo, Japan without a market location selected. If no market location is chosen, the map shows latencies from all markets. Select a Market Location – Any market city can be selected. Select a market provider to view performance information for that provider within the selected market city. All providers in the market city are displayed if you do not select a market provider. |
 |
 |
|