Internet Alerts – Performance API is a powerful tool to monitor the performance of IP addresses across your physical network, CDN, or cloud-based network. The results of this monitoring will alert you to anomalies in latency and packet loss based on the thresholds you set. This document is designed to assist you in understanding the results.
Latency
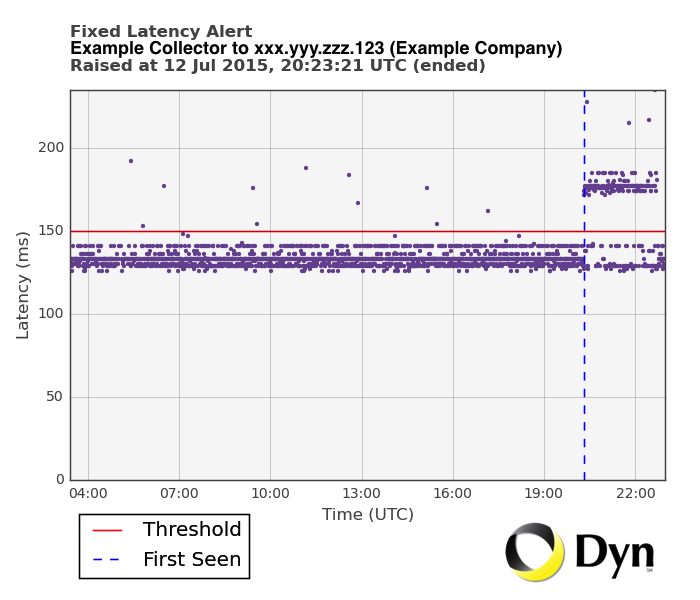
| The title section of the graph identifies this as a Fixed Latency Alert chart. The Fixed Latency Alert graph shows only latency information. The alert graph is sent with the emal alert when a Fixed Latency alert crosses the identified threshold. | |
| The dots represent individual latency measures, which use the scale at the left of the graph.
The vertical dashed blue line is the threshold set at the collector. The horizontal solid red line is the first indication the measurement crossed the threshold for the minimum amount of time to be considered an issue. |
 |
Packet Loss
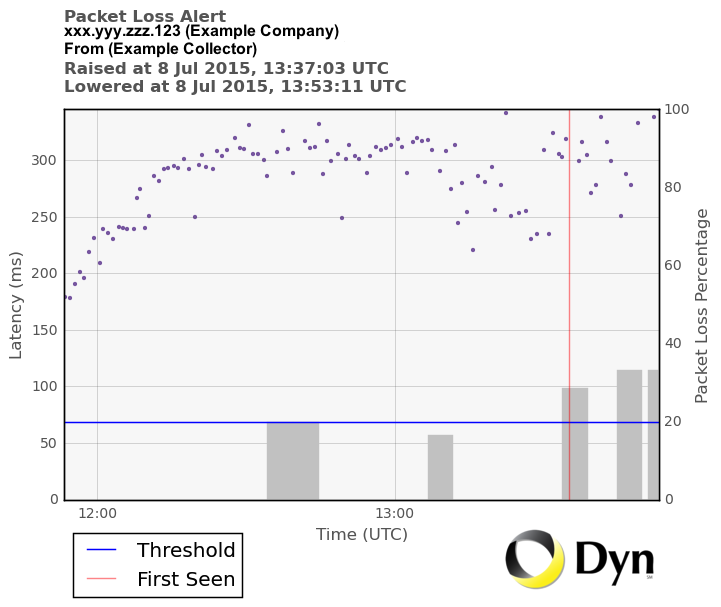
| The title section of the graph identifies this as a Packet Loss Alert chart. The Packet Loss Alert graph shows both latency and packet loss data. The alert graph is sent with the email alert when a Packet Loss alert crosses the identified threshold. | |
| Packet Loss percentages appear as vertical bar graph objects and are measured on the scale at the right of the graph.
The horizontal blue line is the threshold set at the collector. The vertical red line is the first indication the packet loss showed more than the threshold percentage over a 5 minute window. |
 |