Internet Alerts – Performance API is a powerful tool to monitor the performance of IP addresses across your physical network, CDN, or cloud-based network. This document, along with the Getting Started Guide, is designed to give you an understanding of how the alerts work so you can properly configure the product for your needs.
Note for Users who also use Internet Intelligence’s UI: Performance Monitoring status does not display on the Inventory view in the UI. The Monitor toggle switch is accurate for Routing Alerts only.
The Portfolio, Inventories, and Assets
Your Internet Intelligence Portfolio allows you to organize a collection of assets for monitoring. The Internet Alerts – Performance API uses IP addresses to monitor endpoints. Other network assets within the portfolio (including prefixes, Autonomous Systems or Domains) can be monitored using different parts of the Internet Alerts – Routing APIs.
To demonstrate the organizational relationships between these components, here is a graphic (Figure 1) showing a small portfolio with 2 inventories and a total of 3 assets, one asset belongs to both inventories. You can think of the inventories as lists of your assets that may represent your own infrastructure (e.g. core data center locations), geographic locations of your infrastructure (e.g. APAC data hosting) or your competitors’ or customers’ infrastructure. The portfolio simply provides a place to group and organize these inventories. Each IP address you monitor must belong to one or more inventories.
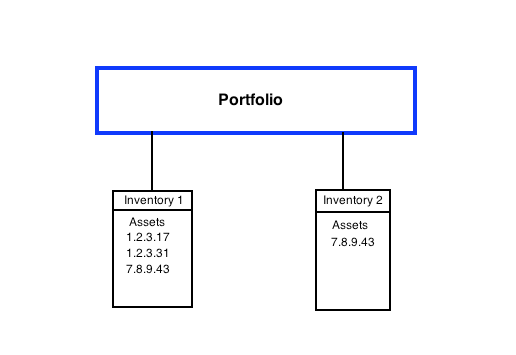
Figure 1
Authentication
The API uses HTTPS with Basic Authentication.
For our examples in this document, we use the cURL command-line tool, which supports basic authentication using -u:
curl -u 'you@example.com:yourpassword' ...
where you@example.com is your Dyn account username.
In the rest of this document, we use username:password as the login credentials.
Understanding Collectors
Collectors represent the starting points of performance monitoring tests. Each collector you configure to run performance tests will run probes to the target end point. Our monitoring system manages the frequency of the polling so that you don’t have to worry if you have the right frequency to capture a service affecting event. Find the list of collectors you can use for monitoring with the Get Available Collectors (API) call.
Running performance tests from your collector initiates monitoring for you to identify the typical expected performance to the target IP address. Once you identify the normal state, you can configure maximum performance thresholds to enable the delivery of the following three types of alerts:
- Connectivity
- Latency deterioration
- Packet Loss
When we observe measurements rise above your thresholds with enough measurements that we are sure it will be service affecting, we will raise an alert, which you can retrieve programmatically via the API or, if you have configured Email notifications, via an email to the configured address.
Within Internet Alerts – Performance, collectors provide the data that determines when you receive alerts, based on your configured thresholds. The key is in setting realistic thresholds so that you receive alert emails when there is an event you need to know about. It means the difference between missing an important event, because an alert threshold was set too high, and being overwhelmed with email alerts, because the alert threshold was set too low. Our measurement graphing API call can help discover the correct the thresholds to configure.