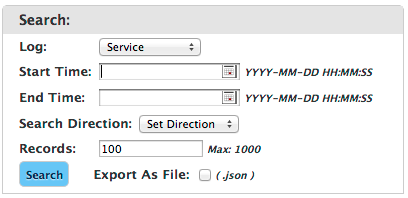
This section by default displays logs generated by both the normal operation and manipulation of the RTTM service. Service logs are organized chronologically and highlight the state of the service at each respective serial change and what action caused that change — Health monitoring, Performance Monitoring or a change in settings by a user. Response set logs are also available and provide the state of a service at any given point in time. Either log is available for display or download as a JSON file.
Search
| Log | Select Service or Response Set as the data to be returned from the search. |
| Start Time | Enter the beginning date and time for your search. Format is YYYY-MM-DD HH:MM:SS. |
| End Time | Enter the ending date and time for your search. Format is YYYY-MM-DD HH:MM:SS. Only available for the Service Log selection. |
| Search Direction | Select the direction to search from the drop-down list. Options include both, backward, and forward. Only available for the Service Log selection. |
| Records | Limits the number of records returned to the number entered. Maximum allowed is 1000 records. Only available for the Service Log selection. |
| Export As File | Check the box to return the records in a JSON file. |
| Search | Click the Search button to launch the search. |

