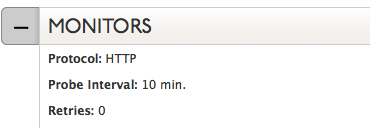
Monitors in Traffic Director determine the health of your network. These filter options will narrow the results to the data you want to see.
In order for monitoring to occur on your account, please make sure the IP addresses included here (https://manage.dynect.net/help/agents.html) can reach all your network endpoints. The web page requires you to log on to Dyn’s Managed DNS.
Note: Total number of records in a single Response Pool may not be more than 255.
Filtering Probe Results
| 1. Select Traffic Director from the Add-Ons menu. | 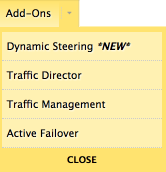 |
| 2. Find the Traffic Director service to where the Probe Results are located and click the Service Name. | 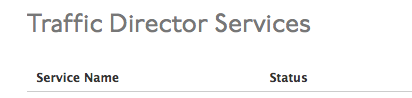 |
| 3. To open the Traffic Director view, find the Monitors section of the Traffic Director Service or the Response Pools section. | 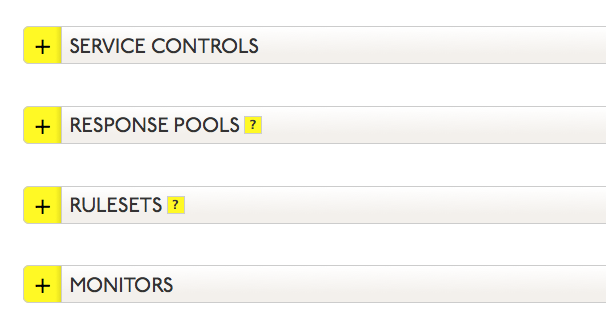 |
| 4. Click the expand button |
 |
| 5. Click Probe Results at the bottom of the Monitor (or Response Pool Record) field. | |
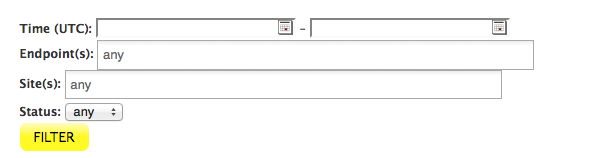
| 6. Select the filtering options to display the results you want.
Time: Use the drop-down calendar to select the UTC date and time for the results to display. Endpoint(s): Click in the field to view the endpoint options. Site(s): Click in the field to view the site options. Status: Use the drop-down list to select any, up, or down. |
 |
| 7. Click FILTER to view your filtered results. |
Understanding Probe Results
Probe results will either be successful or they will have a specific error type. This table outlines the reasons for specific error types you may see
in your Probe Results log. Review the information in this table for troubleshooting ideas for various error messages.
Note: Probes use a majority up or down condition, meaning that if two out of three Probes are up then the endpoint is considered available. If
two of three Probes are down, the endpoint is considered unavailable and will follow the configured failover conditions.
Probes Blocked |
|
| Probe Error | Cause for Error |
| connecting: Connection refused
connection: dial tcp <AGENT IP:PORT>-><ENDPOINT IP:PORT>: getsockopt: connection refuse connecting: Connection reset by peer sending request: read tcp <AGENT IP:PORT>-><ENDPOINT IP:PORT>: read: connection reset by peer connecting: No route to host connection: dial tcp <AGENT IP:PORT>-><ENDPOINT IP:PORT>: getsockopt: no route to host |
If your systems or services are blocking the health check, the monitoring will fail and the endpoint will be considered down. To correct this, you need to allow our monitoring agents the ability to reach the target. This is typically set in your firewall but you should inspect all systems and services that the agents would need to pass through. The easiest way is for you to add our monitoring agent IP addresses to your whitelist. The monitoring agent IP addresses can be seen here: https://manage.dynect.net/help/agents.html |
General Errors |
|
| Probe Error | Cause for Error |
| FQDN lookup | The monitoring agent is unable to resolve the target hostname. This would be when monitoring a CNAME and the hostname could not be resolved to the IP address for various reasons. You can further troubleshoot using dig and be sure to check for potential SERVFAIL issues such as with DNSSEC. |
| Will not monitor | Certain address spaces are explicitly blacklisted by the agents from monitoring, and will return this error if instructed to do so. These are typically address spaces that give back non standard returns or are otherwise malicious to the monitoring agents. |
| Will not monitor: private | The monitoring agents will refuse to monitor private IP addresses. These addresses are reserved for either local networks or other purposes. |
| Internal error | This is an error that occurred on Dyn’s end. Be sure to check https://www.dynstatus.com/ to see if there is a post related to the issue you are seeing. |
Ping Errors |
|
| Probe Error | Cause for Error |
| Ping failed | The ping health check command returned “0 packets received” in its output. This means that either your endpoint failed to respond or the ICMP packets were dropped. You can follow up with an MTR or Traceroute test to diagnose further. |
| Cannot resolve | The monitoring agent is unable to resolve the target hostname. This would be when monitoring a CNAME and the hostname could not be resolved to the IP address for various reasons. You can further troubleshoot using dig and be sure to check for potential SERVFAIL issues such as with DNSSEC. |
| timeout in running phase
timeout |
The target host is unreachable. |
SMTP Errors |
|
| Probe Error | Cause for Error |
| Reading banner / banner read | A problem occurred when the monitoring agent attempted to retrieve the initial 220 banner from the server. These errors cover general connectivity and IO problems with your endpoint. |
| Invalid code | Any code other than 220 is considered a failure. Review the configuration to see if an incorrect port was used and if your endpoint was operational. |
| Invalid banner | The banner’s length must be greater than three characters to provide, at minimum, “220” in the response. Usually the banner is far more verbose, but three character is the barest minimum allowed. The banner could either be too short or malformed. |
HTTP/HTTPS Errors |
|
| Probe Error | Cause for Error |
| Unexpected EOF reading header
reading response: EOF |
Your server indicated the “end of file” character before the agent received the full expected content. In the connection header, the server will provide the Content-Length which will identify how much data the agents should expect. However, the data received when the “end of file” character was received does not match the data expected by the Content-Length. |
| Timeout in connect phase / connecting / sending request
connection: dial tcp <AGENT IP:PORT>-><ENDPOINT IP:PORT>: i/o timeout |
The monitoring agent was unable to establish a connection at all with your endpoint. This could be a misconfiguration or it could indicate a problematic internet path. If only one agent is seeing an issue it could be related to the path for that monitoring agent. If multiple agents are seeing an issue, the problem is likely either your direct network or one of your provider networks. |
| Timeout in header phase / reading headers / header read
reading response: read tcp <AGENT IP:PORT>-><ENDPOINT IP:PORT>: i/o timeout reading response: read tcp <AGENT IP:PORT>-><ENDPOINT IP:PORT> read: connection reset by peer |
The monitoring agent was able to connect but did not receive the HTTP headers successfully. This could be a slow response from your endpoint or a bottleneck on your network. |
| Timeout in body phase / reading body | The monitoring agent was able to connect and received the HTTP headers, but the body content was not received successfully. This could be a slow response from your endpoint or a bottleneck on your network. |
| No address | The monitoring agent is unable to resolve the target hostname. This would be when monitoring a CNAME and the hostname could not be resolved to the IP address for various reasons. You can further troubleshoot using dig and be sure to check for potential SERVFAIL issues such as with DNSSEC. |
| Illegal response | The probe was able to connect with your endpoint but it received an unusual response or a non-HTTP response. A common problem is attempting to use HTTP monitoring on an SMTP server. You should be able to identify if the service should normally provide an HTTP response. Sometimes an incorrect port is set in the configuration or a different host header should be set. |
| Expected not found | The text in the “Expected Data” field was not found in the HTML response that we received from the server. The “Expected Data” text is case-sensitive, and can be present anywhere in the rendered page. |
| Invalid chunk size / reading chunk / timeout in chunk phase | The HTTP data is retrieved from a web server in predefined pieces or chunks of content. These errors indicate the webserver did not send the desired chunk of data to the probe correctly or there was a chunk of data that was not received. |
| Bad response | When a path or expected data is specified in the configuration, any response other than 200 OK is considered a failure. This includes 202, 301, 404, 500, etc. A redirect of the webpage is the most common error. Try updating your configuration to the location found in the redirect. |
| HTTPS ONLY — SSL handshake failed / can’t connect
sending request: remote error: tls: handshake failure |
A problem occurred during the initial HTTPS transaction. This could be caused by a variety of SSL-specific issues, including unsupported certificate types and methods. Make sure your certificates are up to date. |