Answers to questions customers have regarding the online reports for Managed DNS and how these reports align with their QPS or QPM billing.
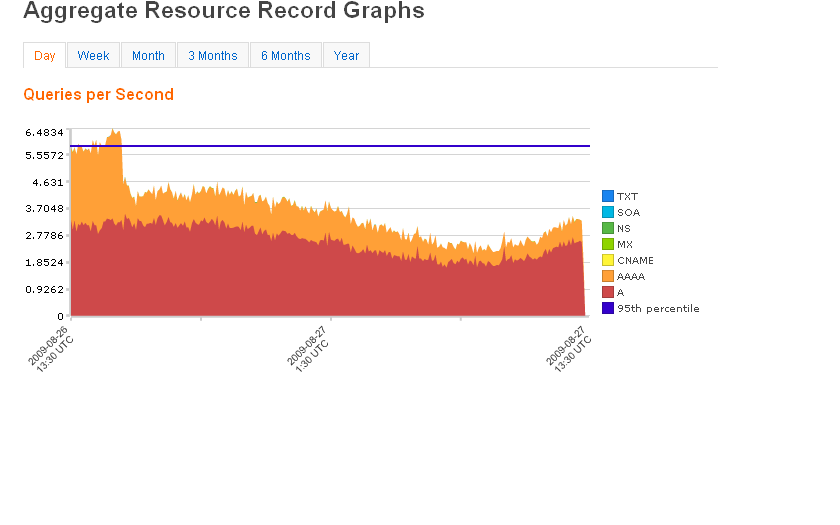
My QPS for all of my zones has suddenly dropped dramatically, as if it “fell off a cliff.” Is there a problem with Managed DNS?

Answer: There could be several reasons for unexpected dramatic drops in QPS data reports:
1) QPS Reporting falling behind: Managed DNS currently processes QPS data for reporting using a multi-processor approach. This means we can provide your QPS data more quickly from our large anycast network (http://dyn.com/dns/network-map/). However, it is possible for one of these processors to fall behind, causing report graphs to display incomplete information while the processing catches up. At no time does this mean that there is an issue with Managed DNS answering DNS queries. We are currently investigating ways to visually display on the graphs when QPS data processing falls behind.
2) TTL Changes: If you have recently risen your TTLs significantly from a very low TTL to a very high TTL (for example, going from 30 seconds to 12 hours) on frequently queried DNS records, this could result in a similar “drop off” in queries hitting our nameservers, as anyone receiving a DNS response back with the longer TTL will cache the response longer until querying again.
I don’t have AAAA records configured, but my QPS report is showing a high number of AAAA record queries. How can I make sure I am not charged overages for these AAAA record queries?
Answer: Some operating systems query AAAA records when they query A records by default. When this happens, you may see AAAA record queries, even if you do not have any AAAA records configured in your zones. This can be the result of the operating system default setting coupled with the SOA minimum value being set too low.

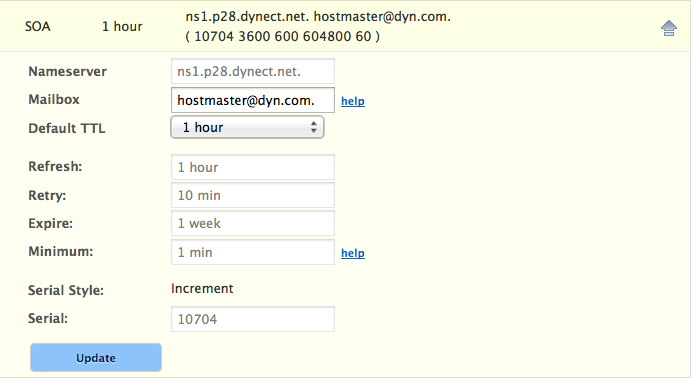
SOA, or the Start of Authority record, indicates that this DNS name server is the best source of information for the data within this DNS domain. The Minimum parameter value on the SOA record is designed to limit the amount of time a user system caches a negative response. A negative response is the SOA telling the requesting system that the record does not exist. The requesting system will cache this information and wait the minimum amount of time before requesting again if the record exists. The default value of the Minimum parameter is 1 minute.

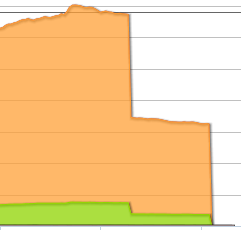
If you are not ready for IPv6 traffic, you can set the value of the Minimum parameter to a higher value. Keep in mind that this minimum value is zone-wide for any record type. Be very sure you understand the implications before altering this value. Setting the value to 1 hour, instead of the default of 1 minute has been shown to reduce the AAAA record queries as shown in this report graph.
How do I align my bill with the QPS reports from my Managed DNS account?
Answer:
There are two types of accounts that bill based on query counts. Enterprise accounts may charge overages based on the contract number of Queries per Second (QPS). Self-ServiceExpress/Lite accounts may charge overages based on the number of Queries per Month (QPM). Customers with either account type may want to calculate their QPS or QPM separately from their billing invoice to confirm their account activity or for auditing purposes.
Query counts can be downloaded from the Managed DNS portal from the View Reports page.
Log-on to your Managed DNS account.
Select View Reports from the menu bar.
Select Total QPS Graphs.
For QPS calculations (Enterprise Accounts):
- Select Day for granularity, the graph will display the QPS for the past 24 hours.
- Download a CSV file of the individual query counts. Select Narrow CSV (for each Timestamp & Query Count measurement to be on its own row) or Wide CSV (for all Timestamps to be in one row and all Query Counts to be in the second row).
NOTE: Timestamps are in Epoch format. There is one Timestamp and Query Count for each 5-minute segment of the day for the past 24 hours. - Billing reports are based on the Daily 5-minute segments.
- In order to track QPS for the month, you can download the daily QPS report at the same time each day. Another way to do this is using the DNS API methods to create a script that runs every day and collects the QPS information. NOTE: The daily QPS report only retrieves the last 24 hours of data and will need to be run daily at the same time to maintain consistency in your billing calculations.
- To get the QPS for the month: take the daily QPS collections, order the 5-minute segments by Query Count highest to lowest, take the top 5% off the list, divide the next lowest 5-minute segment by 300 to get the QPS for the 95th percentile. That is the QPS for the month. The number will be close to the QPS on your billing statement.
- To get a more exact comparison between measured QPS at the 95th percentile and your billing statement, you would need to add the QLD reports to your account.
NOTE: Enabling some Dyn Managed DNS features may affect your monthly billing. Please check the terms and conditions of your contract before enabling any new Services. - Report granularity for Week or Month, have one Timestamp and Query Count for each 1-hour segment of that time period. Report granularity of 3 Months, 6 Months, or Year have one Timestamp and Query Count for each 4-hour segment of that time period.
For QPM Calculations (Express accounts)
If your managed DNS account is an Express account, your billing statement is based on the QPM, or queries per month. QPM is based on the 1-hour segments of the Week and Month QPS reports in the portal. The QPS report granularity of 1 month is a rolling 30 day measurement. If you download this report at the start of the new month (midnight on the 1st of the next month), you will have the data you need for months with 30 days or less to report. For months with 31 days, you should download the 3-month QPS granularity report to get all the days of the calendar month.
To get the QPM for the month: Take the daily QPM segments and calculate the total Query counts for all the segments. That total is your QPM (queries per month).
