Thank you for installing Dyn’s Gauge Chrome extension! Read the information below for a better understanding of how to use this robust performance tool.
The Gauge extension for the Google Chrome browser measures the performance of the internet between your browser and the websites you visit. The Gauge extension records page loading times, geographic latency, and more.
Using the Extension
| 1. Click the Gauge icon in the upper-right corner of your Chrome browser. | |
| 2. Browse the various tabs of analytics information. | |
| My Performance: Reports the average request time of pages in your browser history. Click the URL for a more detailed breakdown of how much time each part of the request takes. | 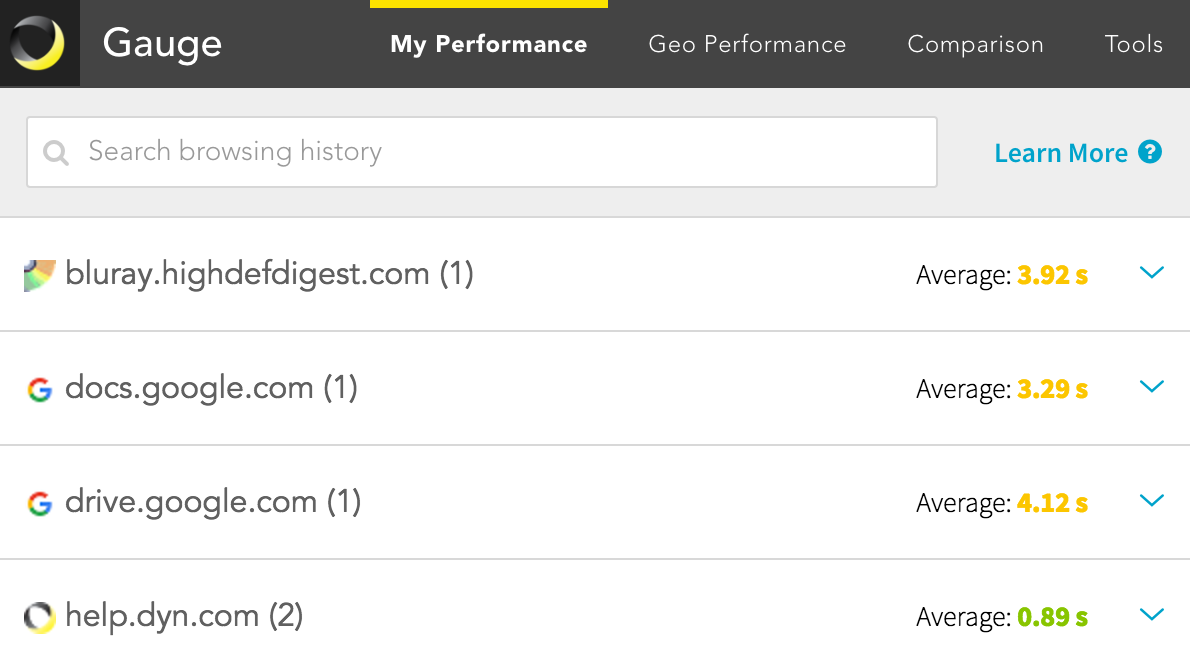 |
| Geo Performance: Reports the geographic location of where websites in your browsing history are loading from and their performance.
Click on the various cloud icons to view specific latencies between your browser and the website or cloud provider. Click the checkmarks beside the latency ranges to filter sites or cloud providers on the map. Use the “+” and “–” buttons to zoom-in.
|
 |
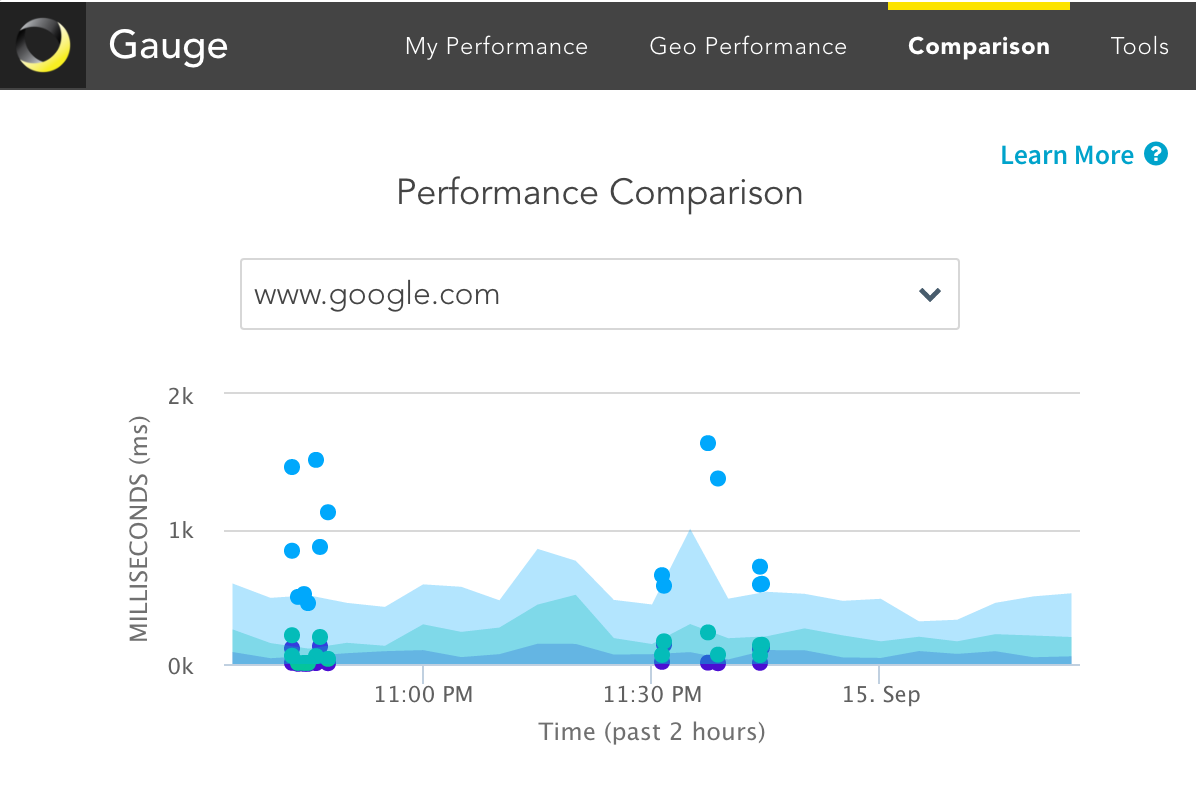
| Comparison: Compares a requested website’s latency, page loading time, and first byte to global averages.
Select from recently visited sites by using the drop-down menu. Toggle the checkmarks on and off to filter data on the graph. |
|
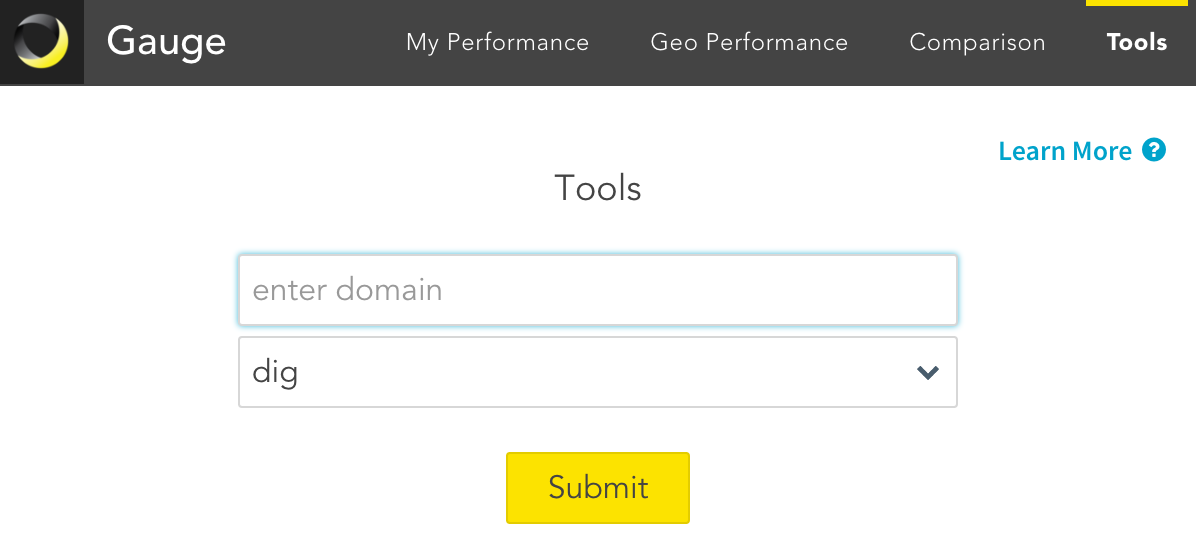
Tools: Gauge comes equipped with several tools to engage the sites you visit.
|
 |