Return to Configure Traffic Management
The Service Controls determine the TTL for the records of the service, notification details, as well as which protocol will be monitored.
In order for monitoring to occur on your account, please make sure the IP addresses included here (https://manage.dynect.net/help/agents.html) can reach all your network endpoints. The web page requires you to log on to Dyn’s Managed DNS.
TTL (Time to Live) – The TTL value for the service will apply to all records in this service. Longer TTLs will cause the values to be cached, and changes will not be propagated in a timely fashion. Values will be clipped to a maximum of half the Interval set for the Protocol(s) in Health Monitoring Options.
Tip: By default we accept TTL in seconds, but you may enter it as a human readable format such as ‘2d’ (2 days), ‘5h’ (5 hours), or ‘20m’ (20 minutes). Acceptable units are: m = minutes, h = hours, d = days, w = weeks, y = years. Only one unit may be specified.
Note: If all fields are left at default for the HTTP, HTTPS, SMTP, or TCP protocols, the measured system will display as ‘healthy’ or ‘online’ if it returns any return code. Adding contents to the Path field will require a 200 level return code for the measured system to display as ‘healthy’ or ‘online’.
Recovery Delay – When a monitored network endpoint is reported down, the recovery delay specifies how many monitoring intervals have to pass before the record is put back into service. For example, after a network endpoint is reported down, a Recovery Delay of 3 requires 3 successful (up) monitoring intervals before the network endpoint is reported ‘up’ again.
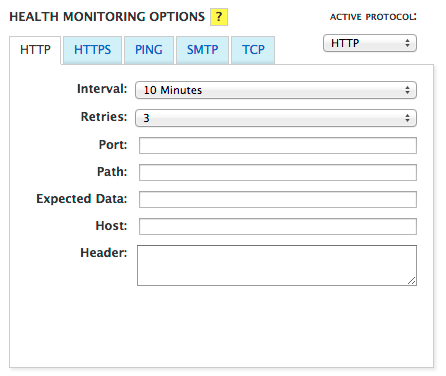
Health Monitoring Options
Use the following information to complete the Health Monitoring Options form:
Click for More Info
Active Protocol – From the drop-down menu select the protocol that you want the agents to use when monitoring the IP address in the pool. Select None to turn off Health Monitoring.
Interval – Time between agent monitoring of the host. Must be twice the TTL setting.
Retries – The number of times the Protocol Monitor retests before declaring a test has failed. The default value is 1.
Port – Designate a port to use while monitoring the host in the pool. Leaving this field blank means it will monitor the default port (80 for HTTP and TCP, 443 for HTTPS, and 25 for SMTP). Available for SMTP, TCP, HTTP, and HTTPS protocols only.
Path – Designate a path other than the root which will be monitored. Paths should be supplied as a relative path to the root ‘/’ i.e.: ‘/path/to/retrieve?with=args&another=one’. Available for HTTP and HTTPS protocols only.
Expected Data – Designate the data expected in the response body. Case-sensitive exact string match required to return ‘up’ status. Available for SMTP, HTTP, and HTTPS protocols only.
Host – Supply a custom Host header. Available for HTTP and HTTPS protocols only.
Header – Used to supply any other valid HTTP/1.1 Request Header fields. Multiple headers may be supplied if separated with a new line.
|
 |
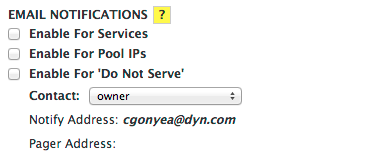
Email Notifications
Use the following information to complete the EMAIL Notification form:
Click for More Info
Enable for Services – Check to enable email notifications for service events.
Enable to Pool IPs – Check to enable email notifications for IP events.
Enable for ‘Do Not Serve’ – Check to notify the contact that an address has been marked as ‘Do Not Serve’.
Contact – Select a single contact from the contacts list to receive email notifications.
Notify Address – Displays the email address of the contact selected.
Pager Address – Displays the pager address of the contact selected.
|
 |
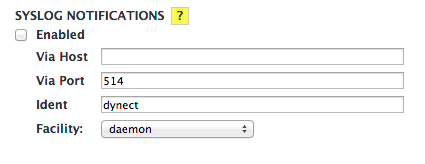
SYSLOG Notifications
Use the following information to complete the SYSLOG Notification form:
Click for More Info
Enabled – Check to set up SYSLOG notifications to the SYSLOG server.
Via Host – Enter the host name for the SYSLOG server.
Via Port – Enter the data port for the SYSLOG server to receive notifications. Event notifications are sent via TCP.
Ident – Unique identifier for the SYSLOG entry. Default is dynect.
Facility – Method by which the SYSLOG is appended. Default is daemon process.
Note: SYSLOG notifications will come from one or both of these IP addresses: 216.146.40.70 — or — 216.146.41.70
|
 |
