When you receive an alert for a CDN that is being monitored in your Portfolio, you will be able to access details about the alert, such as the duration of the asset’s degradation and the level of latency.
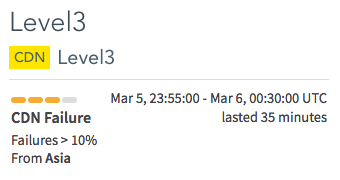 |
The details of the alert will be displayed in the upper-left corner, including the start and end time of the alert, and the Cloud, CDN, or Host location where the alert was identified. |
The Performance Timeline displays a visual representation of the start time of the alert, failure percentage, the applicable latency measurements, and latency threshold.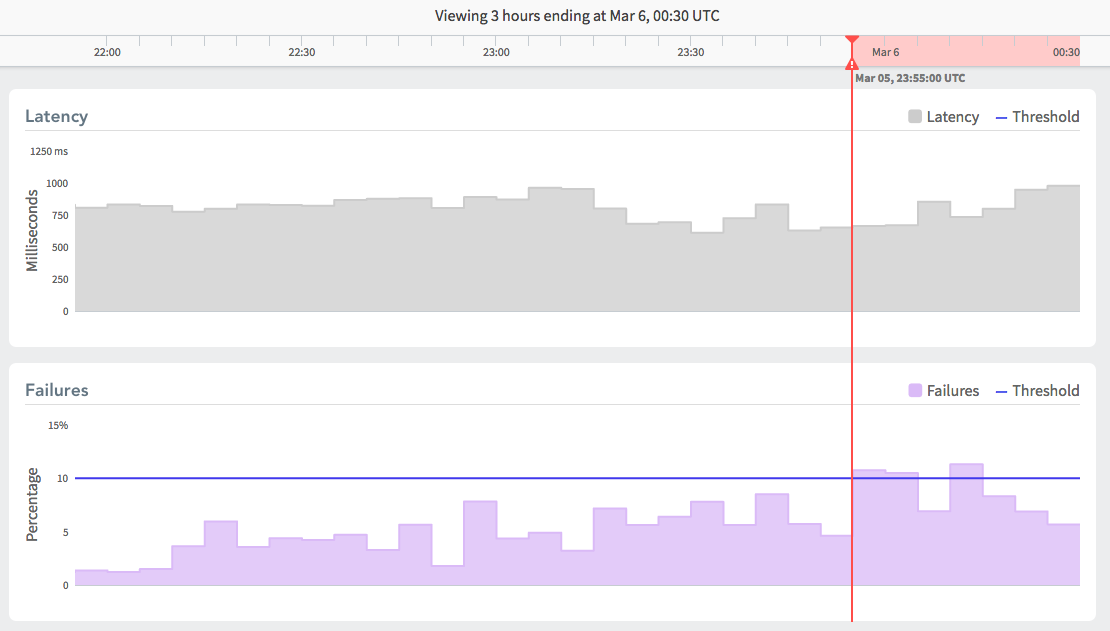
Latency – A calculated percentage of packets that failed to reach the destination asset. Latency Threshold – The acceptable level of latency for this asset, as set by the asset’s Monitoring Configuration (INTERNAL NOTE: link to Enable Monitoring). Failures – The percentage of queries that failed to reach the asset. |
|