Use the Compare Provider view to view information for one or all providers to the market city. You must select a market city in order to have data in the Compare Providers view.
Latency and Provider Settings |
Provider Charts and Data |
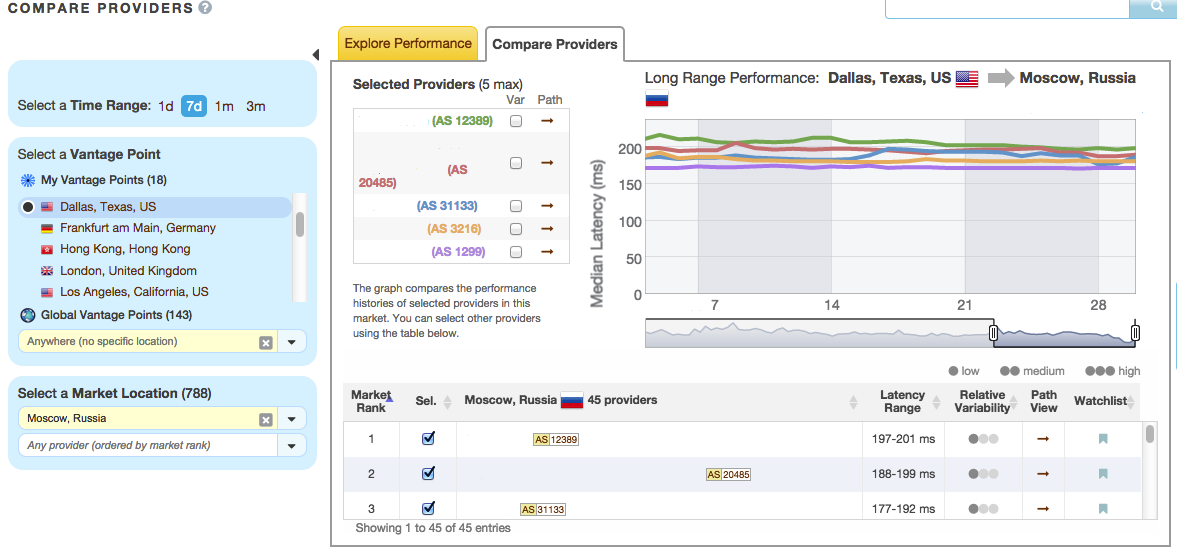
| Select a Time Range – the length of performance history to display. Options are 1 day, 7 days, 1 month, or 3 months. This example shows 7 days.
Select a Vantage Point – any global vantage point can be used. This example displays Dallas, Texas. Select a Market Location – any market city can be selected. Select a market provider to view performance information for that provider within the selected market city. This example shows all providers for the market city Moscow, Russia. |
Selected Providers: The providers, maximum of five, marked in the table as Select. Each provider is color coded to match the latency on the performance chart.
Long Range Performance Chart – the median latency measurements over the Time Range for the 5 Selected Providers, color coded to match the Selected Providers list. Table of Providers:
|
 |
|